Wednesday, October 28, 2015

Bad Breadth?

As this rally continues to take out resistance levels, we've committed a fair amount of time trying to uncover just how sustainable it might be.

A few weeks back, one could have argued that several breadth indicators were suggesting that the market was being pulled higher by particularly narrow leadership.  However, in recent days/weeks, we've seen an increase in participation and individual stocks showing strength.

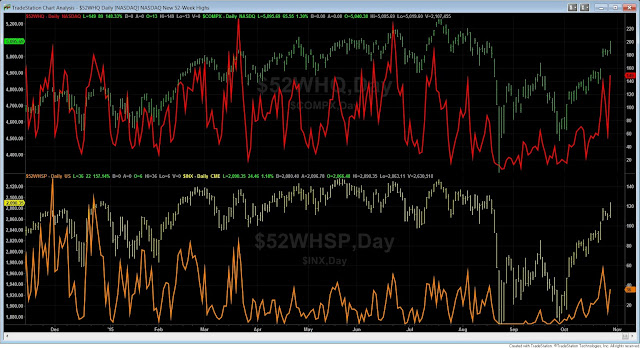
For starters, we've seen a nice move in new 52-week highs in the Nasdaq.  In the chart below, the red line serves as the new 52-week high indicator and as you can see, the measure has kept pace with the Nasdaq's advance.  What this means is that a collection of stocks have helped to pull the index higher by advancing to yearly highs.

The bottom of the chart shows the same comparison for the S&P 500 which has yet to be accompanied by such strength.


Other measures we watch also suggest that breadth is strengthening.  We're seeing a strong breakout in stocks making 20-day highs along with a healthy rise in the % of stocks above their 10, 20, and 50-day moving averages.

On the flipside, one data point that bears watching is the Nasdaq and the negative divergence currently in place with its Advance/Decline line.  As the index has shot back toward its highs, the A/D line remains stuck in a downtrend and has not confirmed the recent price highs.  Ideally, you'd like to see this line rising in stride with price as it would be suggesting that the majority of stocks in the index are participating.  With the index being cap weighted, it has staged this rally on the backs of some of its premier names, Microsoft, Google and Amazon, to name a few.


Breadth has certainly improved in recent weeks and we're seeing increasing signs of this being a healthy rally.  We may be a little overheated here in the short-term but nothing a small pause wouldn't relieve.


Saturday, October 24, 2015

Week In Review (10/19 - 10/23)

Stocks logged their 4th straight week of gains as the major indexes saw impressive gains on Thursday and Friday.  The combination of strong tech stock earnings reports (Microsoft, Google, & Amazon), a surprise interest rate cut out of The People's Bank of China and European Central Bank President, Mario Draghi, hinting that more quantitative easing measures were on the way for the Eurozone.

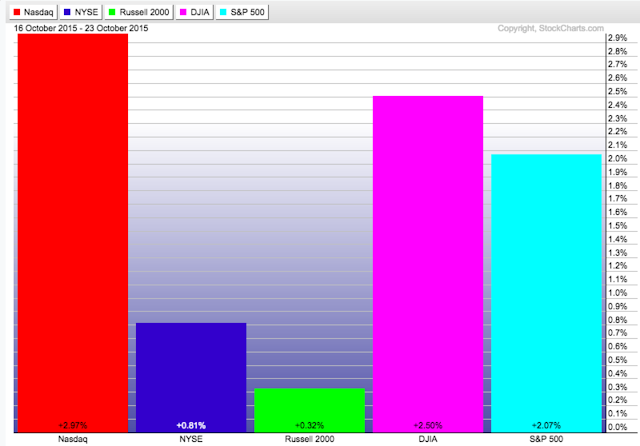
When the Friday closing bell sounded, the S&P 500 had gained 2.1% for the week while the Dow and Nasdaq gained 2.5% and 3%, respectively.


The week's strong gains were enough to propel the S&P back into positive territory for the year and the month of October is shaping up to be one for the record books.  The S&P is now up 8.08% for the month and if things were to stay as they are, it would be the 6th best October ever according to Ryan Detrick.


So with that said it should come as no surprise that it's been a banner month for all of the major US equity benchmarks with the Nasdaq leading the way.


Stretching the lens out to a year-to-date view, we see the Nasdaq, again, is the clear leader. Meanwhile, the Russell 2000 (small caps) and the Dow remain negative on the year.


Overseas markets have seen powerful rallies in October as well.  As mentioned above, serious talk of further QE action in Europe has propelled those markets higher while Japan continues to be a pocket of strength on a relative basis.


On Wednesday morning, we covered what we thought to be some of the more relevant bull and bear data points at this point in the market.  After weighing the evidence, we argued that a slight bullish bias might be warranted through year-end and after 3 days, we look like geniuses!  Unfortunately, we'll hold off on the celebration until the book is closed on 2015.  Taking a much shorter-term view, the market does appear to be a little overheated here.  This chart from Raymond James shows that the S&P is now the furthest above its 50-day MA since last December and it may be wise to exercise some caution here in the near-term.

This makes some sense now that the index has rallied just about 11% since the end of September.  Digging deeper into the market, nearly every sector group has fully participated in this rally.  Looking at the S&P domestic sector etfs we see that only Health Care and Utilities have truly lagged behind.  As mentioned, Tech has been incredibly strong while Energy is finally getting a bid as well.


Wednesday, October 21, 2015

Weighing The Bull & Bear Cases

Right now, the popular topic for debate is whether or not the 2015 market bottom is in.  If it is, a proper follow up question is are we headed back toward a low-VIX trading environment where a sustained uptrend is established and dips can be bought along the way?  On the flip side, if the August-September lows are to be tested again, the question is how do we get there?  Is the significant overhead supply just above current prices going to create a ceiling on this bounce while the VIX shoots up again, causing further choppy downward action.

A 3rd and what we'd consider the most unfortunate scenario can't be ruled out either.  It would take the form of the market having a sideways to slight upwards bias with lots of chop where rallies are sold and dips are bought.  It would be accompanied by low volume, low VIX and low momentum follow through.

We take stabs at building cases for each scenario daily.  Below we've listed out evidence in support of each side:

Trend
  • S&P 500 monthly chart and its 12-month MA.  This simple long-term trend following tool remains bearish but is getting close to trading back above the MA.
  • Testing the back side of the failed monthly uptrend from 2009 bottom.
  • On shorter time frame a ton of overhead supply from the Feb-Mid August top.
  • All 9 major sectors are above their 20-day MA, all but 1 are above 50-day, 4 out of 9 are above 200-day.
  • XLY:XLP ratio continues to consolidate in uptrend.  A break below would be bearish.
  • Relief rally in emerging markets.: EEM, EFA, FXI.  EEM has broken up above shorter-term down trendline but facing significant long term resistance.
  • We continue to monitor the consolidation in the dollar and oil markets.  A breakout in either direction will have ramifications for the global markets.
S&P Monthly & 12-Month MA

S&P Monthly Chart Below Long-Term Trendline

S&P Daily Chart - Key Test of Overhead Resistance

XLY:XLP

Emerging Markets (EEM)

VIX
  • Has come back below the breakout level and has dropped like a stone.
  • VIX term structure back in contango after spending a good month in or around backwardation.

Breadth
  • Overbought on short-term and but not yet on intermediate term  (% of stocks above 20 & 50 MAs)
  • Stochastic overbought on major 4 domestic index's
  • A/D line advancing with market but still in downtrend with overall market
  • % of stocks above 40-day has gone from extreme oversold to overbought.  Very similar to Oct. 2014 bottom.


Sentiment
  • NAAIM Exposure index still remains light.  This is bullish.  Still plenty of money to put to work.  
  • Fear & Greed Index is Neutral
  • Put/Call Ratio - Has backed off extreme readings and back in normal range
  • Bearish sentiment remains elevated even after the current rally.  This is contrarian and good for bull case.


Putting this all together gives us a better idea of how these scenarios might play out and provide for a better strategy going forward as we try to put the probabilities in our favor.

Right now, we're more inclined to think the market is likely to take out overhead resistance after working off the current short-term overbought levels.  This bullish scenario could be propelled further by the best 3-month calendar timeframe in terms of historical seasonality on deck. Couple that with plenty of cash on the sidelines from active managers and an accommodative/dovish Fed and the stage may be set for a rally.

What will change our opinion is a negative market reaction to the upcoming rush of earnings announcements that's joined by an expansion of downside breadth.

Sunday, October 18, 2015

Week In Review (10/12 - 10/16)

The S&P 500 added 0.46% on Friday and finished the week with a 0.9% gain.  This leaves the index now down just -1.3% year-to-date after having climbed more than 8% since the September low.  The Nasdaq outpaced the S&P on the week, adding 1.2% and now sits higher on the year by 3.2%.  Small cap stocks however, as benchmarked by the Russell 2000 index, were not able to participate in the week's gains.  The index dropped -0.3% and now sits down -3.5% for the year.


The market was lead higher by strong performance out of the Health Care (+1.93), Utilities (2.26%) and Financial (1.33%) sectors.  Industrials, on the other hand, could not keep up with the gainers as the sector was down -1.55% for the week and continues to be one of the weaker groups in the market.  Industrials are now down -5.7% for the year which leads only Materials (-7.9%) and Energy (-10.7%) in the S&P sub-groups.


As we mentioned earlier in the week, as the market has rallied from the September lows, it's done so on the back of some of the year's most unloved stocks and sectors. In an October 9th study, Bespoke took a look "under the hood" of the current rally and made some interesting observations.  Chief among them being that this rally looks a bit different than many of the recent past given that it's been lead higher by the "most unloved, beaten-down names, while prior market darlings have lagged."

And as you can see below, the first 13 trading days of October have been a total boon for the year's two biggest losers, Energy and Materials.  They're up 13% and 10.5%, respectively since the end of September.


We could be in for an interesting week upcoming as in addition to a wave of earnings reports, we get China's third quarter GDP announcement on Monday and the European Central Bank will meet and announce new monetary policy decisions on Thursday.  So we'll see what, if any, kind of volatility that mix of events throws into the market.  

This linked article from Ryan Detrick has some eye-opening stats on market performance in the month of October.  Historically known as one of the worst month's for stocks, it's actually fared pretty well over the last 20 years.

Detrick, however, does note that the month has historically featured some pretty dramatic volatility and perhaps we'll get a reminder of that over the next two weeks.

Tuesday, October 13, 2015

A Look At The Current Rally

Even after today's modest pullback, the S&P 500 is still up over 4% so far in October.  Bespoke Investment Group notes that the average stock in the S&P is up more than 6% since the market hit its recent lows on September 29th.

In an October 9th study, Bespoke took a look "under the hood" of the current rally and made some interesting observations.  Chief among them being that this rally looks a bit different than many of the recent past given that it's been lead higher by the "most unloved, beaten-down names, while prior market darlings have lagged."

In the study they broke the S&P into 10 groups of 50 stocks based on each stock's performance from the index's 5/21 all-time high through its 9/29 low.  They then calculated the average performance of the 50 stocks in each decile during this current 2 week rally.

The chart below shows the results.  The decile labeled "Best" is the group of 50 stocks that performed best during the 5/21 - 9/29 period.  That group has returned only 3.7% since September 29th.  Meanwhile, the 50 stocks that performed the worst over the 5/21 - 9/29 period are up an incredible 15.4% during this bounce.


The chart below from Stockcharts helps to further illustrate the recent rotation in leadership as we see Energy, Industrials and Materials, three of 2015's biggest laggards,  leading the way over the last two weeks.


It's a bit early to draw any hard conclusions from the last 10 trading days.  We're not ready to concede that these sectors are poised to take the market even higher as they were the groups most deserving of an oversold bounce.  We're also not sold on the idea of the overall market being completely out of the woods here.  There was considerable damage done in August and September and we'll need to see some more signs of health before taking anything more than our current reluctantly bullish posture.

Tuesday, October 6, 2015

Quick Observations

Here's a quick roundup of observations on the market action of the last several days:
  • The market was due for this oversold bounce after several areas and sectors had re-tested their August lows.
  • We got just that as the S&P 500 posted its first 5-day winning streak of 2015 and gained 3.5% in the first 3 days of October.
  • Many charts showed positive divergence on last week's test of the lows -  For example, there was a massive dry up of stocks in the S&P making new 52-week lows compared to the market's late August drop.  See the 2nd chart below.
  • The market has now rallied into areas posing significant overhead resistance.  
  • This current area includes the 50% retracement point of the range from the year's highs to the recent lows, the S&P's 50-day moving average is at 1,998 (the index closed at 1,980 today) and it's an area the index visited several times during December 2014 - February 2015 timeframe.


Further, there's been a lot of concern surrounding high yield bonds lately and deservedly so.  One related chart that looks pretty worrisome is the ratio chart of JNK to LQD.  It has broken significant long-term support and now sits at levels not seen in several years.


Thursday, October 1, 2015

Trading Psychology 2.0

We're incredibly honored to be highlighted and quoted in Dr. Brett Steenbarger's latest book, Trading Psychology 2.0: From Best Practices To Best Processes.  In addition to authoring the very popular TraderFeed blog, Dr. Steenbarger is a Clinical Associate Professor of Psychiatry and Behavioral Sciences at SUNY Upstate Medical University in Syracuse, New York.  He has worked since 2004 as a performance coach for proprietary trading firms, investment banks, and hedge funds including Tudor Investment Corporation.

He's previously written three books and also writes a blog for Forbes that covers the field of positive psychology as it relates to peak performance.

Dr. Steenbarger sought our comments on the topic of developing and integrating best practices in one's portfolio management processes.  He tackles the subject in Chapter 4 of Trading Psychology 2.0 and our passage is laid out below:

---

It's easy to become so caught up in trading that we fail to review--and learn from--our trading performance.  The successful money managers I've worked with have had structured processes for previewing markets, viewing markets during trading hours, and reviewing trading once the day and week are finished.  Previewing brings preparation and rigor to trading; reviewing allows us to stand back from our decisions and take a coaching perspective, turning ordinary performance into true deliberate practice.

A powerful best practice is conducting a structured performance review to evaluate yourself and your trading.  One example is offered by Ryan Worch, principal at Worch Capital.  He explains:

"I always want to be confident that I'm operating with an appreciation for the larger picture.  It's easy to get bogged down in the day-to-day action so I make a point to create a series of monthly goals and observations.

At the end of each month, I perform a post-analysis on all of my trades.  This is where the real work is done.  I assess every trade and figure out what worked and why it worked.  By doing so, I'm hoping to see what is being rewarded in each environment.  From this, I can set goals for the next month.  Sometimes breakouts are working, or mean reversion, or pullback trades.  The only way to determine this is by breaking down every trade at the end of each month.  This process loop and feedback is critical to staying engaged and adapting to ever changing markets.

I'm challenging myself and asking questions during this process.  What characteristics did the winners have?  What did the losers have?  Is there a pattern to be recognized?  I record all of this for future reference.  This is a feedback loop that makes me a better trader and helps me break down information more quickly in future markets and trades.

Some quantitative examples are:  % winners vs. losers; average win vs. loss; % of equity risked; % of equity gained/lost; % gain/loss on each trade, etc.

From a qualitative standpoint:  What caused the position to move (surprise, upgrade, downgrade)?  What was the surrounding market environment like?  Were outside forces at play (geopolitical event, monetary policy event, etc.)?"

Note that Ryan is reviewing both the market environment and his specific trades.  By seeing which trades are and aren't working, he gains insight into the market that can be fed forward into future trading.  That insight can also help him take more risk in favorable environments and pull back his risk taking in murky ones.  The structured review is both a learning tool regarding markets and a tool for improving trading performance.

---

If you're serious about maximizing the psychological aspect of your investing endeavors, we highly recommend you pick up a copy of Dr. Steenbarger's latest work.  It's an enjoyable, coherent read for all levels of investors.