Showing posts with label IWM. Show all posts

Thursday, July 30, 2020

Time for a pause?

It has been a sensational run off the March lows considering we are still in the thick of a pandemic.  The next few months have plenty of known unknowns that could create more volatility than the market has experienced in the last four months.  Whether it is the upcoming election, geopolitical maneuvering with China, daily riots, or just the summer doldrums the market has plenty of news worthy items to answer over the next few months. 

The current market looks and remains bullish as the S&P, Nasdaq, and Russell 2000 all remain above their upward sloping 50 day moving average and in a confirmed uptrend.  The charts below speak for themselves as the last four months, off the March low, has been straight up and to the right.  A classic sign of a trending market.  

Yet, as risk managers we are always looking ahead against potential trouble.  If we look under the surface the existing trend might not be as strong as characterized and is getting a little long in the tooth. A great quote from Paul Tudor Jones in the classic Market Wizards book nails home this point.  "I know that to be successful, I have to be frightened.  My biggest hits have always come after I have had a great period and I started to think that I knew something."

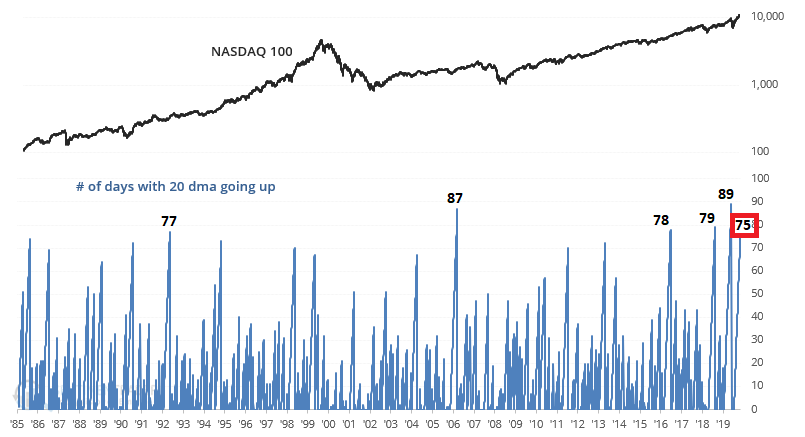
Sentiment trader lastest tweet shows the incredible persistent trend in the Nasdaq and how this usually ends in a pullback, as this is the 6th longest streak ever. 

Image

One area that has put us on watch is the weakening breadth.  Most of this could be a product of 5 stocks now make up 20% of the S&P.  Regardless, we prefer to see expanding breadth rather than a negative divergence.  This can resolve to the upside but it is something to keep on your radar.  Below we can see that the the percentage of stocks trading above their 50-day moving average is declining while both the S&P and Nasdaq continue to rally. 


As we stated earlier the current market looks bullish.  A recent note from the guys at Macro Ops points out that we are likely at the "As Good As It Gets" point with asset returns.  The BofA all-weather portfolio (25% stocks, 25% bonds, 25% cash, 25% gold) has just seen its best 90-day returns in history.  Another example that this market could be exhausted and ready to punish the greedy. 


The weight of the evidence in the longer term suggest higher prices.  We covered many of these in prior posts about strength begets strength.  One interesting stat that provides a bullish case longer term is a study from Ciovacco Capital showing the massive exhaustion in the VIX and how this is actually positive. 


We remain bullish long term as we believe the market is in a secular bull.  Considering the new rounds of stimulus and rates at historically low levels this should bode well for the bull thesis.  But that doesn't mean the market could be ready to take a pause and the evidence in the short term could support that.  As we enter the heart of earnings season we'll be looking to see if the trend can remain up or does the weakening breadth ultimately catch up to prices and the market enters a period of chop and potential draw down.  We attempt to be prepared for any scenario and ultimately price will determine who is right. 

Tuesday, December 10, 2019

Rounding out a decade

2019 is shaping up to be one of the best years for asset class returns.  It is a mirror image of last year in which every asset class except cash posted a negative return.  We have talked a lot about how strength begets strength and that has proven consistent all year long.   As we enter the final few weeks of the trading year there is no shortage of bulls and bears as we turn the clock on a new decade.

We remain in a favorably bullish period for the markets (Nov-April) and December is one of the best months of the year with a 1.50% average gain while finishing higher almost 74% of the time.

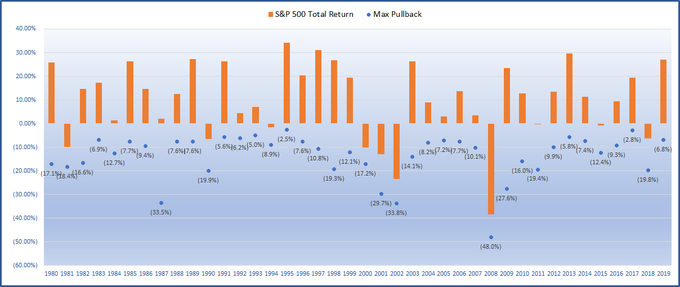
Not only has 2019 been a great year for the equity markets it has also been one of the least volatile.  According to Ryan Detrick, "the S&P 500 has pulled back 6.8% from peak to trough in 2019. This is actually one of the smallest pullbacks we've seen in recent memory."

Image 

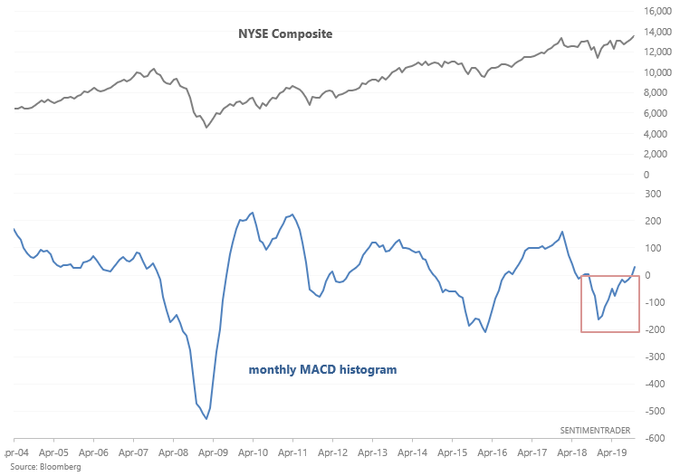
A great study from Sentiment trader trader shows the MACD indicator setting up bullish for stocks the next year.  Monthly MACD's are now turning positive for the Dow and NYSE Composite for the first time in >1 year. This is bullish for stocks on a longer term basis. When this happened in the past to the NYSE Composite, stocks went up 100% of the time 6-12 months later.

Image

As we embark on a new decade we also enter the 4th year of the presidential cycle.  Nautilus Cap does great cycle work and below shows the S&P seasonal composite for the forth year of the election cycle which shows first half volatility follow by a resumption of the trend and strong close to the year. 

Image 

On thing that has been missing from this market is complete market participation.  As equity indices hit new highs the amount of stocks hitting 52 week-highs is non existent.  In fact, more stocks are hitting new 52-week lows.  Meanwhile the A/D line supports the trend which is encouraging.  This all amounts to mixed signals from participation.  We can see from the chart below the A/D line in yellow is confirming the strength in the NYSE Composite while new highs total just 19 and are strongly outnumbered by 106 new lows.


If breadth is to confirm the strength in equity market it will need participation from small caps.  They have trailed the larger cap indices all year but are starting to gain traction.  Even though the Russell 2k remains below all-time highs posted in 2018 it did make a new 52-week high recently.  If you are buying small caps you are making a bullish bet on domestic growth in 2020.  If the economy avoids a recession, which we think is likely, and the economy accelerates, small caps will be a good bet.  Economic recoveries “tend to be the best phase for small-caps,” says Jill Carey Hall, an equity and quant strategist at Bank of America Merrill Lynch. “That’s one key reason we think we could be poised for a shift from large to small.” Small-cap outperformance is one of Bank of America’s biggest bullish predictions for 2020, strategists there said this past week.


When it comes to the economy, there is plenty of supporting data for growth to resume in 2020.  There has been no earnings growth this year.  According to FactSet, Q1 earnings were down 0.2%, Q2 earnings were down 0.4%, and Q3 earnings were down 2.2%.  In fact, it will market the first time in 3 years of three straight quarters of year over year earnings declines since Q4 2015 through Q2 2016.  Yet, equities are trading at all time highs.  Why is that?  Typically, equity prices are forward looking.  The most recent jobs report just printed an unemployment rate of  3.5% which is a 50-year low coupled with a surge in jobs.  With an accommodative Fed keeping interest rates low along with the good news for the US labor market in the November employment report could help validate the acceleration in the economy and earnings picture in 2020.  


Something to keep an eye on and one the bears will point to is valuations.  The US is one of the most expensive markets in the world based on P/E ratios.  Alex Barrow from Macro Ops highlighted this in his recent weekly update.  "Looking further out though into 2020 the SPX is going to be fighting some decently strong headwinds in the form of stretched valuations absent a visible driver of earnings growth. The below chart from Goldman Sachs shows the year-to-date rally has been almost entirely driven by valuations rerating higher. Over the longer-term, this is unsustainable — especially in the US where valuations are already high. Either earnings growth will need to pick up materially or equities will hit a wall."


These lofty valuations has Morgan Stanley lowering expectations for the next decade.  Morgan Stanley expects the opposite for the next 10 years, as it sees valuations and returns reverting to their means. Translated, today’s high stock prices point to low future equity returns. Low bond yields necessarily mean lesser fixed-income returns. Moreover, taking on bigger risks also isn’t likely to pay off in bigger returns, the investment firm adds. “We estimate the average 60%/40% stock/bond portfolio will return only 4% to 5%, roughly half that of the past decade,” writes Lisa Shalett, chief investment officer at Morgan Stanley Wealth Management, in a client note.

As markets embark on new highs, lets check in on sentiment.  Considering the recent strength from the October lows we would expect to see overheated levels.  The CNN fear and greed index is flashing greed but is not overly excessive. 


More supporting evidence that we could get a year end rally is the NAAIM Exposure Index which represents the average exposure to US Equity markets reported by active managers.  It is elevated but still well below 2019 highs as markets sit at yearly highs. 


In summary, if earnings and economic growth accelerates in 2020 higher valuations can be justified with the low interest rate envrionment.  However, if said growth doesn't materialize the markets could be in for a volatile ride considering what they seem to be pricing in. 


Thursday, August 15, 2019

Bear Market or Pullback?

Since hitting new 52 week highs at the end of July the market has experienced three highly volatile down weeks. Most indices are off between 6-7% from their highs.  With all the negative news and sentiment you would think we are in the teeth of a bear market and the market is going to collapse.  Is this the start of a bear market?  We really don't know the answer to that.  There are plenty of pundits that will tell you with certainty that we are doomed.  But if we step back and look at the data we can begin to shape a narrative.  As always, there is no shortage of news items and events to worry about.  Below are just a few:

China's devaluation
Trade war
HK protests
China debt issues
Yield curve inversion
Potential for recession
Slowing growth
Negative yields across the world
Gold spiking

The one thing that worries us the most, is the confrontation between China and HK.  If the PLA invades to quell the protests this could turn into a global event and the potential black swan for the markets.  According to Henrietta Treyz at Veda Partners this is going to be our modern day Tiananmen Square.  "Meanwhile, it continues to be the view of the Republican caucus and some on the Street that the ongoing Hong Kong protests and paramilitary escalation will require a robust response from both the United States and increasingly Japan based on our conversations in the last 48 hours, both in terms of economic sanctions and public outcry. There is a general sense amongst trade counsel on the Hill, particularly from within the Republican caucus (where we spend a good deal of our time considering their votes would be necessary to advance any tariff-stripping authority in the US Senate) that escalation to the scale and scope of Tiananmen Square 30 years ago is more likely than not."

Currently all this angst have driven sentiment heavily bearish and only after a 6-7% drop.   This leads us to believe that the news media has created more hysteria than reality.  If we look at the recent BAML fund managers survey it can give us a good read into sentiment and positioning.  

Below are the key takeaways from the monthly survey:

The BofAML August Global Fund Manager Survey

The nut: August BofAML FMS most bullish on rates since 2008 as trade war concerns send recession risk to 8-year high; investors slash exposure to cyclicals to buy US Treasuries & US growth stocks; with global policy stimuli at a 2.5-year low, onus is on Fed/ECB/PBoC to restore animal spirits.
On growth: 1/3 of FMS investors expect global recession in the next 12 months, the highest since 2011.
On policy: FMS investors say global fiscal & monetary policy mix is the most hawkish since Nov'16; only 9% see higher bond yields in the next 12 months, the most bullish stance on rates since 2008.
On leverage: 1/2 of FMS investors say corporates are excessively leveraged, a new record; investors want corporates to use cash to improve balance sheets capex or buybacks.
On risk appetite: in contrast to June, the FMS cash level did not surge as growth expectations plungedAugust cash levels fell from 5.2% to 5.1%; BofAML Bull & Bear Indicator holds at3.7 (not extreme bearish though record net % say they have taken out protection).
On rotation: FMS investors sold cyclical value (Japan at 7-year low, industrials 2nd biggest MoM drop ever), bought defensives/growth (staples, tech) & bonds (#1 most crowded FMS trade = long US Treasuries); "growth over value" highest since GFC.
On US: FMS investors say US equities are the most preferred region over the next 12 months despite 78% saying the region is overvalued; note combination of two 2nd most extreme on record (#1 Aug'18).
On bubbles: FMS investors say biggest central bank-induced bubble risk in: #1 corporate bonds (33%), #2 Govt bonds (30%), #3 US equities (26%), #4 gold (8%).
FMS contrarian trades: contrarians should be long inflation vs. deflation assets (equities>bonds, Japan>US, industrials>pharma).

Below are three charts that sum up the fear among fund managers.   

34% of FMS investors thing a recession is likely in the next 12 months which is the highest recession probability since October 2011.
 The dominant concern of investors remains the ongoing trade war with China. 


Meanwhile the most crowded trade remains long US treasuries in a flight to safety as the Fed has started to now lower rates and global capital is flocking to US bonds. 

The recent AAII survey saw pessimism spiked to its highest level and optimism plunged to its lowest level since December 2018. Bearish sentiment is now unusually high and bullish sentiment is unusually low.

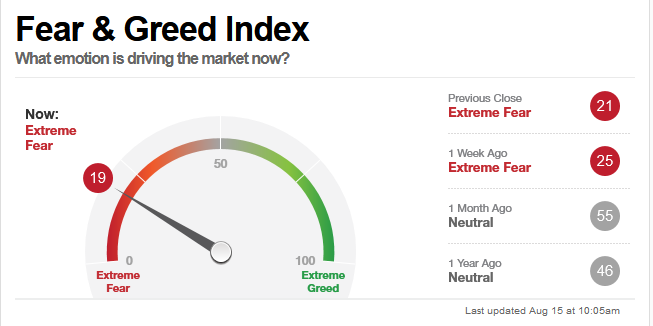
The most recent CNN fear and greed indicator shows extreme fear.  


The VIX term structure has inverted showing more fear and pessimism.


Now that we have touched on what investors are worried about and how that has affected sentiment lets look at how the charts are shaping up.  The Dow, S&P, and Nasdaq remain in uptrends and well above their Dec. 18 lows.  The one area of concerns is the Russell 2k which is making lower highs and lower lows since the 1st quarter. 


A closer look at the Russell 2k shows a classic breakdown from a diamond pattern.  Small caps have lagged all year and continue to do so.


What is interesting is the strength of the market this year has been on the back of growth.  Growth has drastically outperformed value.


Yet, low volatility has outperformed high beta since last October and the ratio chart is making a new low.  


On top of that Gold and Bonds are outperforming equities since July.  Both remain extremely oversold and reside in their upper bollinger bands on the weekly charts.  Historically, these are areas where a breather is needed.


With the data presented above you can certainly see why investors are nervous.  We asked the question earlier if this was the beginning of a bear market.  We really don't know but some stats below help the bulls case.  A tweet by @PeterMallouk says "Over the last 40 years, when the U.S. yield curve inverted as it did today, the market was up 66% of the time 1 year later and 33% of the time 3 years later. Globally, the market is up 86% of the time 1 year later and 71% of the time 3 years later. Source: DFA"
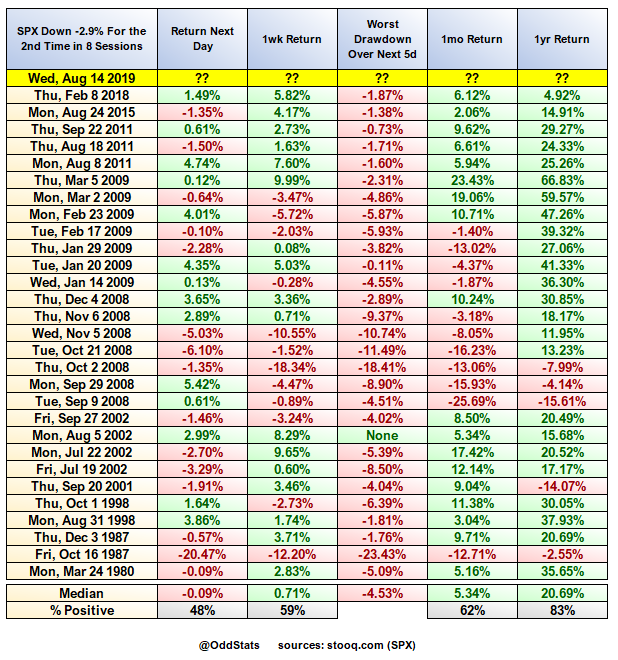
And after yesterday's plunge in the S&P you would think it spells trouble for the market.  However, a study from OddStats shows "The S&P 500 $SPX just saw its second -2.9% day in 8 sessions. Because you assume that means the market is collapsing to zero, here's every other time that's happened in the past 40 years. Last 6 events, $SPX was sharply higher a week later."

Image
Considering 33% of FMS investors say they have taken out protection against a sharp fall in equity markets in the next 3 months vs. 51% saying they have not; the highest net score since the survey began asking the question in 2008.

On top of that allocations are heavily positioned for low growth/recession.  When we assess the data and sentiment the market is ripe for a vicious short covering rally at some point.  We don't believe we are entering a bear market but rather a correction within the ongoing secular bull.   Are we subject to more downside first?  Sure, but we still believe the market has a tailwind with an accommodating Fed and heading into an election year.  There are times when it pays to be aggressive and times to raise some cash.  We are buyers into weakness but will be prudent when picking our spots. 


Tuesday, July 2, 2019

New Highs - Now What?

It has been a volatile few months with the markets straight down in May only to rally in a V-shaped manner in June.  The S&P 500 is back testing new highs as this is the third test of highs going back to September 2018.  So far the last few months have played out nothing like the historical average.  Going back to 1950, the average May shows a gain while June shows a loss.  July remains one of the stronger months while August is the second weakest month.  How with the rest of the summer play out? 


One primary concern of many investors is the lagging performance of small caps.  It is last index not at or close to new highs. It remains well below the September 2018 high.  See the bottom right chart.


However, the Russell 2000 underperformance should not be a primary concern according to a study from Mark Hulbert.

Another great post from Urban Carmel at the Fat Pitch Blog highlights why investors should be more worried when small caps lead.  "By contrast, small caps are lagging. They have retained none of their gains made over the past 1-1/2 years and haven't been close to a new ATH in 10 months. Should investors be worried?  By most measures, the answer is probably not. Small cap underperformance has more often marked a low in SPX, not a high. Investors should be more worried when small caps - which are highly speculative and high beta - lead, as this has most often been a feature of major bull market tops, the reverse of the situation we have now."

One of the measures we follow to get a general sense of participation is breadth.  There remains some conflicting signs.  While the cumulative A/D line is advancing to new highs with the S&P, there are a number of other contradicting breadth measures. 


The percentage of S&P stocks trading above their 50 day moving average peaked in the first quarter and has yet to take out new highs along with the market. 


The number of stocks making 52 week highs on the S&P peaked June 7th during the start of the current rally.  It has made lower highs as the S&P is making higher highs. 


Another indicator we track and follow is a measure of overbought/oversold conditions.  We track the amount of stocks up 50% in a month.  This gives us a good idea of when a market gets excessive.  As with all indicators you have to take them in context.  Overbought signals at the beginning of a trend can be viewed positively.  However, if you get them after an extended run they can signal exhaustion. If we study the table below it gives a few clues.  We looked at every instance since 2010 when the indicator first reached overbought levels.  We removed the clusters.  The returns are weaker against the whole sample in all four time frames.  Going out 10 and 20 days is the biggest divergence in returns. 


As we remain in the challenging 6 month stretch of May through October we look to secondary indicators to confirm the trends.  The trend remains up and bullish as most indices are at or close to new highs.  Small cap underperformance shouldn't be viewed as big as a negative as the pundits make it out.  The A/D line is a broad measure confirming the trend.  However, for the markets to sustain and ultimately blow through new highs on the upside we'll need to see the secondary indicators participate. 

Have a great 4th of July!


Friday, March 1, 2019

A look to March and beyond

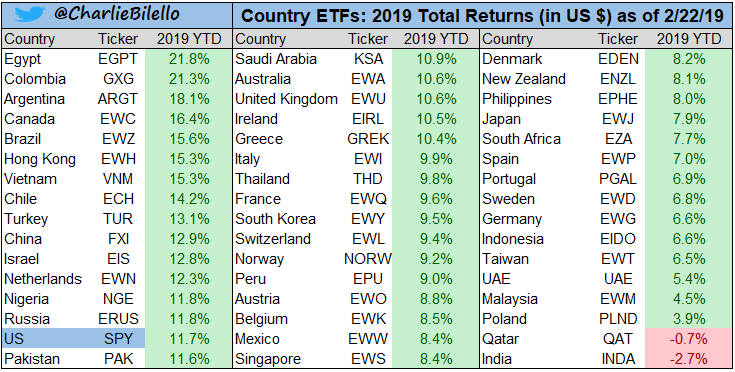
The global markets have started off 2019 on a blistering start with the average return of +10%. According to Charlie Bilello, global equities are off to their best start to a year since 1987: 46 out of 48 country ETFs positive w/ an average return of +10%.  Domestic markets have been extremely strong after a tough 2018 with small caps and tech weighted indices leading the charge.  We have gone from a risk off 3-month bear market to a V-shaped risk on environment.  The Russell 2k fell 12 out 16 weeks while the NDX fell 9 out of 12 weeks from their fall peaks.  Since their December trough, both the RUT and NDX have rallied 9 weeks in a row.  Can they extend the streak to 10 weeks?  During the same stretch the VIX has gone from over 35 to below 15.  Needless to say, its been a volatile 6 months since the September 2018 highs.  How does the current strength position us for the rest of the year?


The statistical analysis sets up very favorably for sizable gains the rest of the year based on the current strength YTD.  Below are various studies that validate strength begets strength.  As much as we use data and statistical analysis to shape our bias and views we have to remember that the predictive nature of data is just one tool that we use to guide our thesis.  Last year was a great example of how useless this data can be and a good reason why we don't follow it blindly.

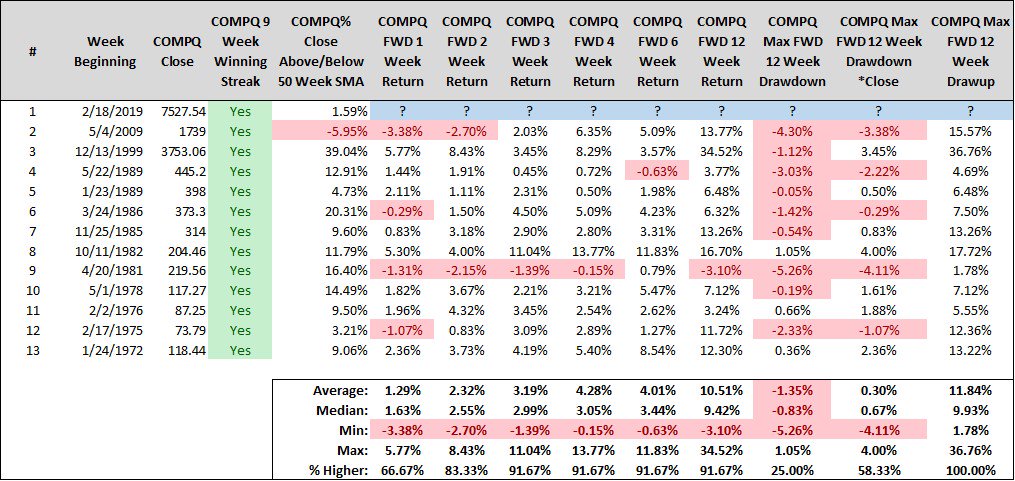
Steve Deppe has a nice table showing what happens after the Nasdaq has gained 9 weeks in a row.  If returns 3 months from now meet the historical average (10.5%), Nasdaq will be well above its September all time high. 


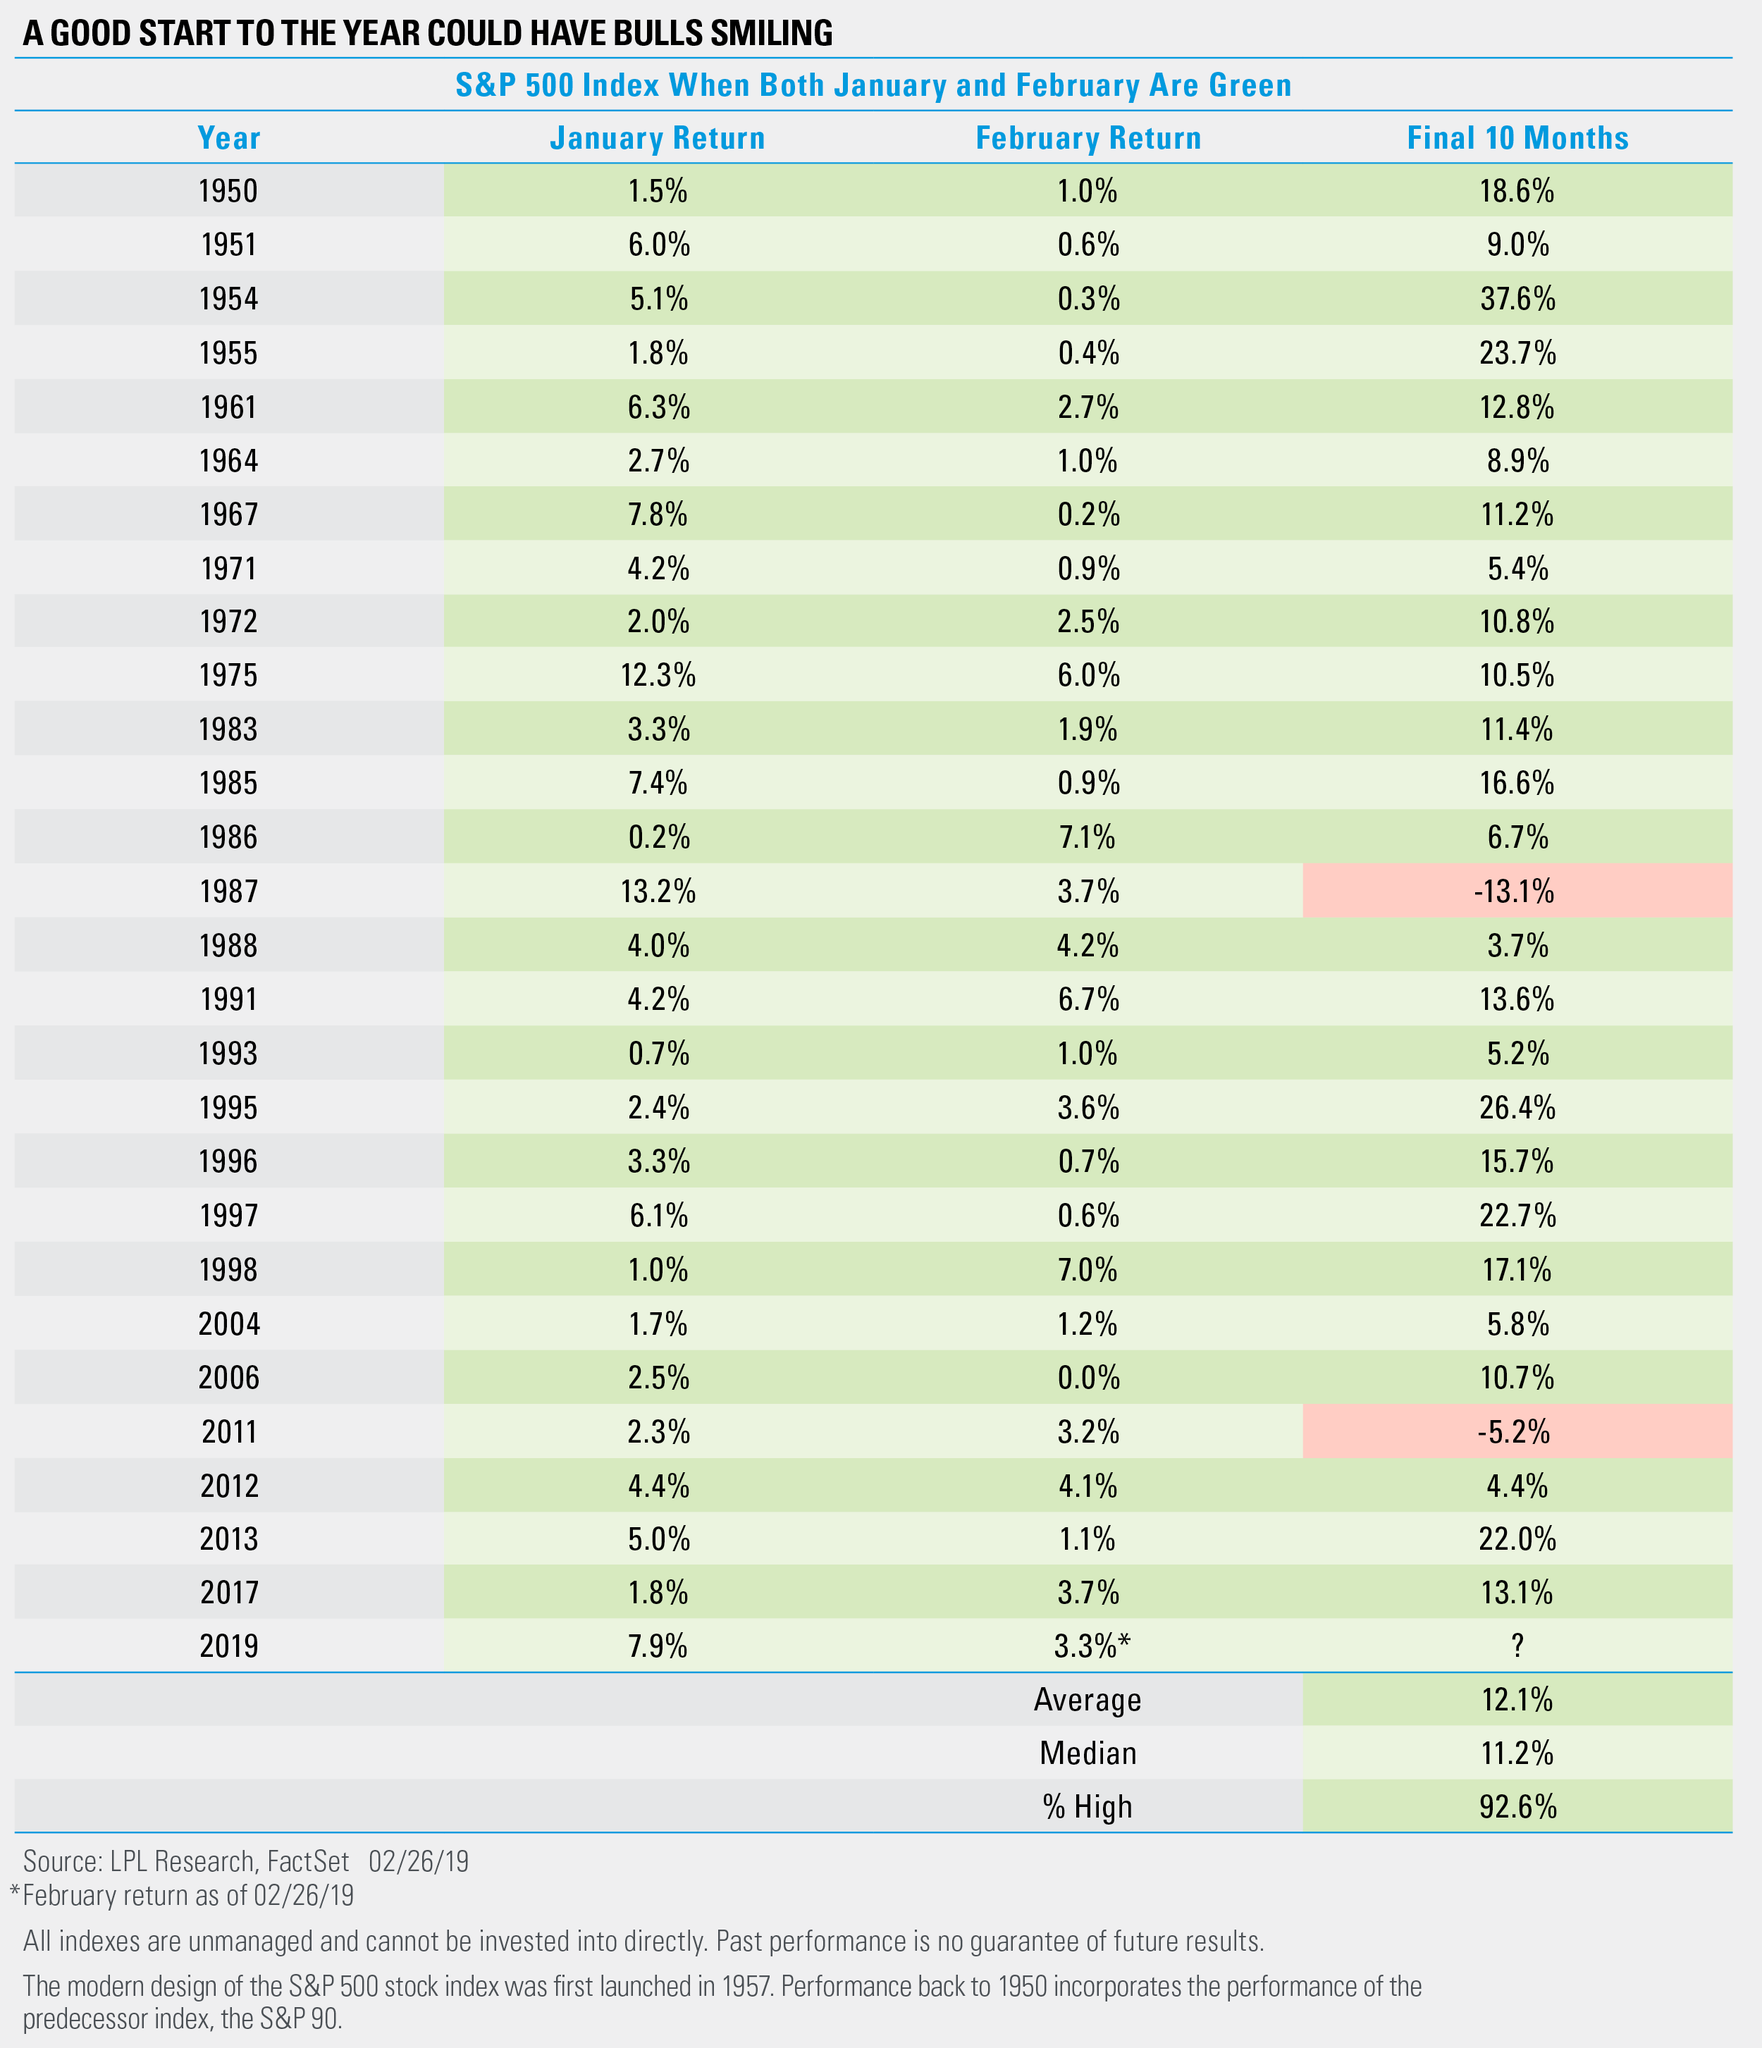
A post from Ryan Detrick shows the past 27 times the S&P 500 was higher in both January and February saw the final 10 months gain 25 times. Additionally, the avg return is 12.1% versus an avg final 10 mos of 7.6.


According to Nautilus Capital when the S&P is up 7.5% or more through February, gains continue to be promising going forward. 


An interesting stat from Bespoke speaks to the strength of the winning streak to start the year.


Are you tired of winning yet? Based on the S&P 500's start to 2019, the odds are that if you aren't tired of winning now, you will never be.  With the S&P 500 on pace for its 27th up day in the 37 trading days so far this year, 2019 is on a record pace for the frequency of positive days to start a year. Throughout the history of the S&P, there has never been a year that saw so many positive days in the first 37 days of trading (73%), and there have only been seven other years where the percentage of positive days even topped two-thirds at this point in the year. For reference, in an 'average' year it typically takes until March 16th before the S&P 500 has its 27th positive close of the year,and the longest it ever took for the S&P to reach its 27th positive close of the year was in 1932 when the 27th up day wasn't until April 21st.

The morning track from Raymond James chief strategist Jeff Saut had some good commentary from Leoy Tuey.  "Word of wisdom from Leon Tuey as many brokers continue to look for a test of the low.  While short-term overbought, a pause is all the bears can expect, but no major setback because:

1. In December, investors panicked and sold down to "sleep level" and beyond. Consequently, they are grossly under-invested inequities and are sitting on record cash.
2. While short-term optimism has risen, sentiment backdrop remains one of fear, not pessimism, but fear.
3. More importantly is global easing. Because of global slowing, the EU, Japan, and the U.S. are becoming more dovish. As mentioned in my reports, last year, Jerome Powell, the Fed Chairman, made a profound announcement that few paid attention: "We would like to smooth out the wild swings in past economic cycles by fine-tuning the monetary policy." If successful, the US and the world will see a period of unparalleled prosperity as history shows that the best environment for equities is in a period of modest growth and stable inflation, not too hot, not too cold, the so-called Goldilocks economy.
4. The record highs set by the Advance-Decline Lines speaks to the strength and power of this bull market. Will they test the lows, not bloody likely!"


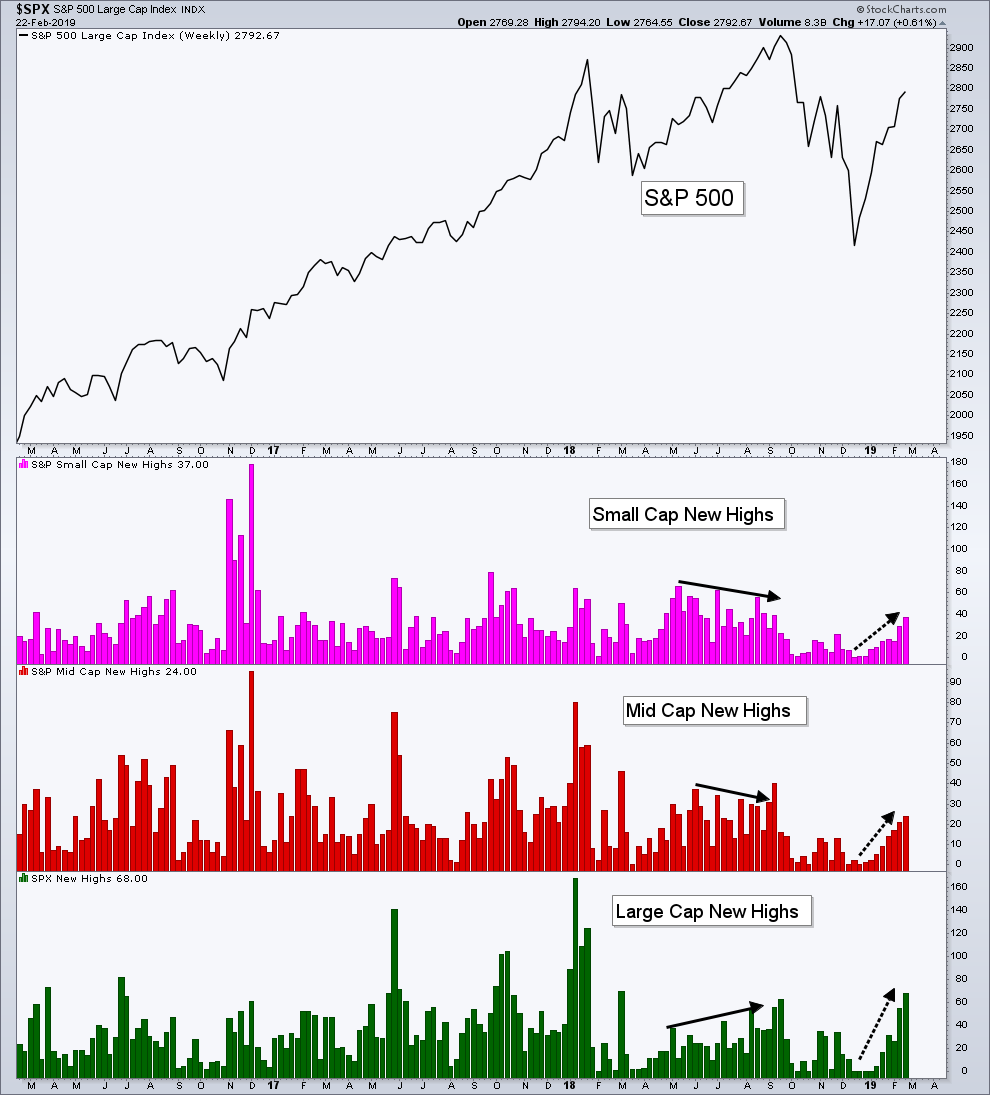
Breadth has confirmed and added to the bullish theme to start the year.  An expansion of new 52-week highs along with the % of stocks trading above their 50 and 200 day moving averages continues to increase. 


While I remain concerned about the volatility landscape, it is encouraging to see new 52-week highs continue to increase across small-, mid-, & large-caps - a luxury we didn't enjoy going into the September high.


The % of stocks trading about their 50 day moving average is higher then the Jan and Sept 2018 peaks. 


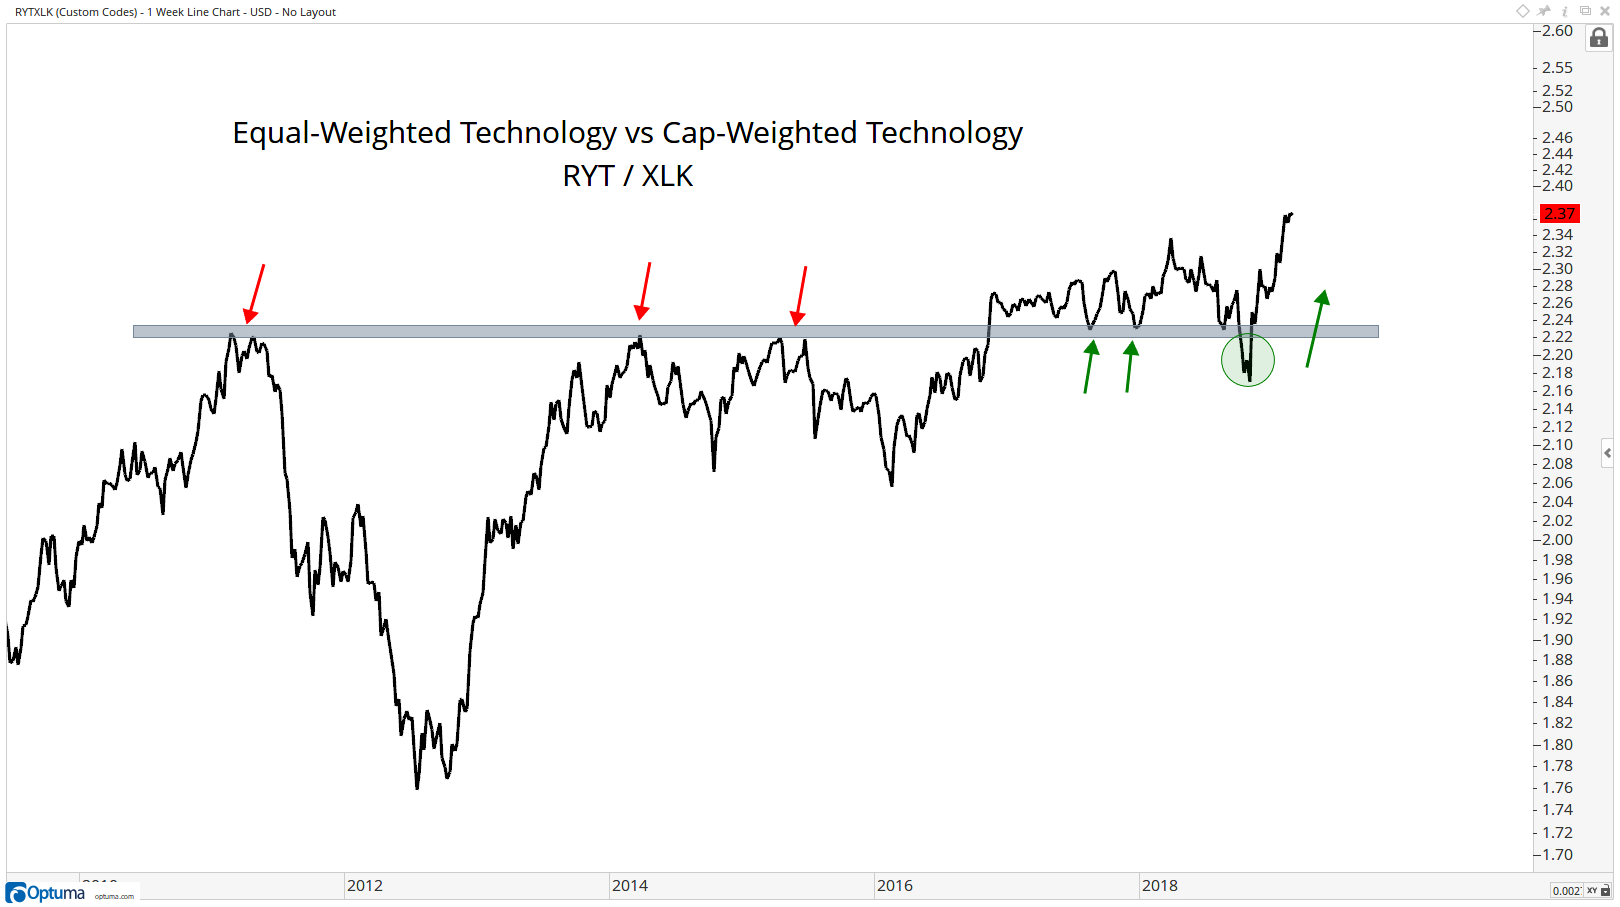
The S&P on an equal-weight basis has led the move higher and taken out the November and December highs before the cap-weighted index.  This suggest broad participation and expansion of breadth.  Meanwhile the equal-weighted tech index is outperforming the cap-weighted tech index.  The FAANG stocks have been a headwind for the cap weighted indices.  If they start to rally this move could really get into overdrive.


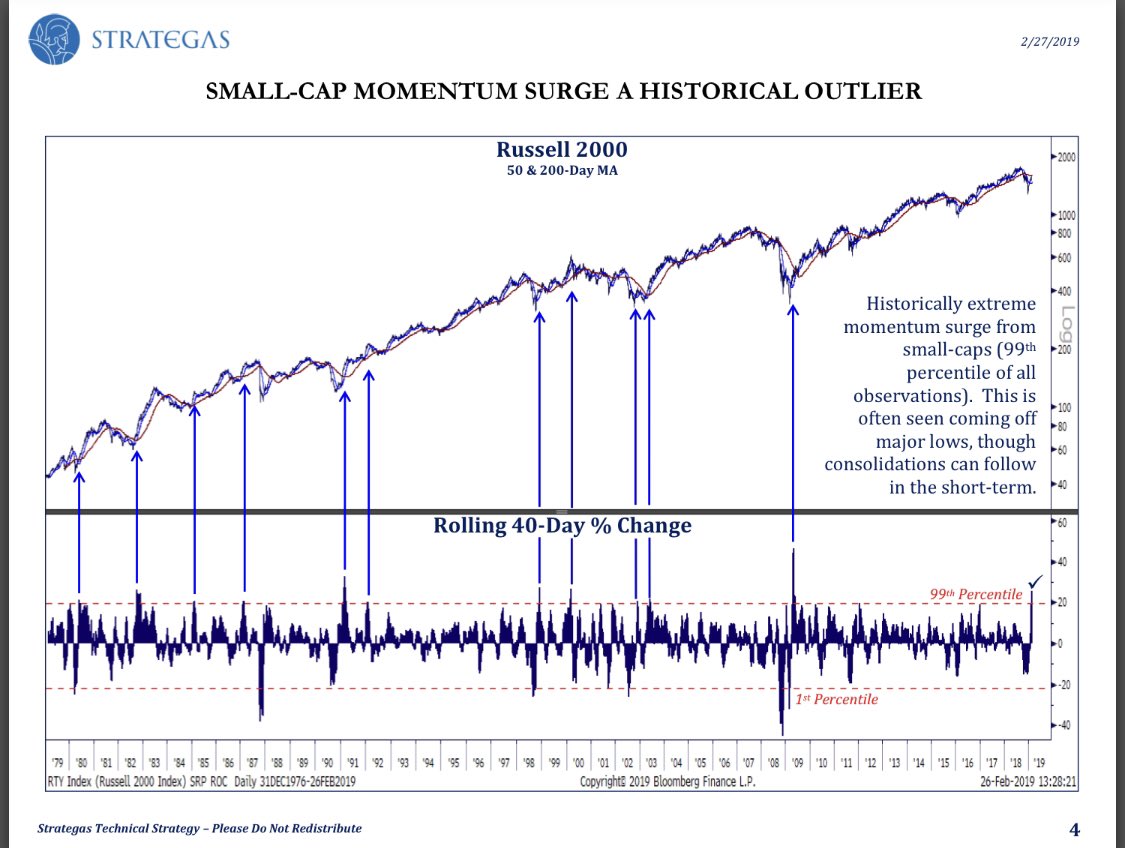
The rally to start 2019 has been nothing short of spectacular.  We remain oversold throughout the rally and their is some evidence that the indices could retrace some of the gains in the short term.  There is typically a period of consolidation after strong rallies. 


40 day % change for small-caps in 99th percentile! Historically rare - data says pause in near term, but better than average returns +6 months forward.


Urban Carmel at the fat pitch blog highlights a case from 1989. DJIA rose 9 weeks in a row and then went into a 10% trading range lasting the next 8 months. It eventually broke out of this range and made a new ATH another 8% higher. The lesson: a set up for a longer term continuation higher can sometimes take a frustrating long time to unfold.


We started this blog with a question about how the current strength positions us for the rest of the year.  In summary, the data suggests a favorable environment for continued gains throughout the year.  Breadth has been expansive, confirming the strong trend higher.  However, there is some evidence that a period of retracement or consolidation is a decent probability in the short term.