And to be honest, "a bit of a breather" is an understatement. Over the last two trading weeks, the index has stayed in one of the tightest ranges in its history. In the last 11 days, the S&P has traded in a 0.61% range (based on closing prices) which makes it the tightest movement over that timeframe since August of 1995. The research team at LPL Financial ran the numbers on how these tight ranges have tended to resolve themselves. A number of other research groups also made note of the dull market conditions over the back half of the month.
The NASDAQ on the other hand continued to power higher with an assist from upside earnings surprises by a number of tech's biggest names including Facebook, Apple, Google/Alphabet and Amazon. The index finished the week with a gain of 1.2%, leading all of the major US equity indexes.
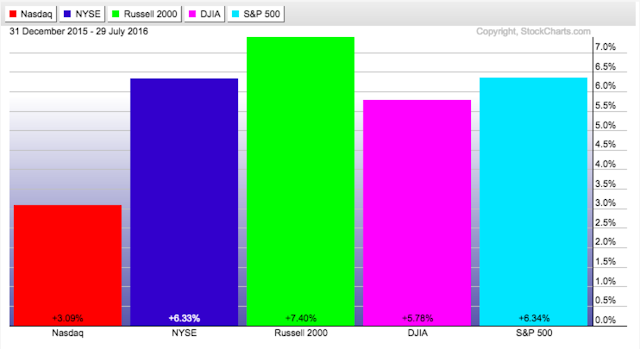
Along with the NASDAQ, the Russell 2000 was also able to finish the week in the black. This was a theme that played out over the entire month as small caps and the NASDAQ led the way higher with each up more than 5% in July.
After the massive rebound off the Brexit chaos, all US stock indexes sit comfortably in positive territory in 2016 as we enter the seasonally challenging August - October timeframe.
As the markets and the economy have accelerated in recent weeks and proven immune (for now at least) to whatever fallout may come from Brexit, we've seen renewed talk of the possibility of the Federal Reserve moving to raise rates before year-end. And while those discussions may have picked up in pace, futures markets are still betting against such a move. Per Briefing.com: "Rate hike expectations receded throughout the past week. Since last Friday, the implied probability of a rate hike in December, estimated by the fed funds futures market, declined from 47.8% to 33.0%. The fed funds futures market does not expect the Federal Reserve to depart from its current target range until after July 2017."
As mentioned above, August and September have tended to be some of the more volatile months for stocks. Urban Carmel noted that since 1945 of all the months where the S&P has fallen 5% or more, August and September have combined to provide more than a third of them. Additionally, August has proven to be the weakest month on average for the S&P over the last 20 years.
So we go into August with stocks at all time highs, trend and breadth looking remarkably strong, earnings season has been respectable and the economic data points suggest a turn better. Couple that with the tendency for tight ranges like we've seen in recent weeks to resolve higher and it's easy to anticipate further gains for equities. However, one must consider the historical seasonal weakness of the coming 30-60 days and be prepared for the potential of another quick pullback.
Timeframes are everything right now and we're prepped with an open mind to consider all scenarios.


