Wednesday, July 19, 2017

July Monthly Fund Manager Survey

The monthly fund manager survey (FMS) from BAML is out and always contains an interesting view on the global investing landscape.  This month's survey doesn't deviate much from last month's.  Fund managers continue to worry about the same set of issues while their positioning continues to be overweight the same areas.  Cash levels remain too elevated to set conditions for a market top yet growth expectations continue to trend lower.  Below are the key takeaways straight from the July survey.


  • Bottom line: 1. cash levels still too high for "big top"; 2. too many see Fed as likely negative catalyst while inflection lower in growth/EPS estimates being ignored; 3. energy>banks, US>Eurozone, commodities>cash (Exhibit 1) = best contrarian trades
  • July FMS cash levels dip from 5.0% to 4.9%; but cash remains well-above 10-year average of 4.5% & allocators very OW the asset class(Exhibit 1)…cash too high for "big top"
  • 3 most crowded trades: long Nasdaq (38%), long US/EU credit (15%), long Eurozone equities (12%)…means ECB most likely central bank to spark global "risk-off"
  • 3 biggest tail risks: crash in bond markets (28%), Fed/ECB policy mistake (27%), China credit tightening (15%)…central banks seen as muchbigger risk (the "red herring") than EPS, and yet…
  • …clear inflection point lower in FMS growth/EPS expectations; 38% expect stronger growth vs. 62% in Jan; 41% expect stronger profits vs. 58% in Jan
  • July rotations: investors bought Japan, healthcare, materials, commodities; investors sold tech (68% say US/global internet stocks "expensive"), UK, discretionary, industrials
  • July positions: big longs in banks (knocks off tech as #1 global sector OW), Eurozone, EM; big shorts in UK, energy & US stocks (last time UW in US stocks larger was Jan'08)
Banks have overtaken tech as the most overweight global sector as 68% say US/global internet stocks are "expensive", 12% say "bubble-like", and 15% say "fair".  With the Fed on a hiking cycle and the potential for global tightening underway we understand the overweight towards banks.   However, for the third straight month "Long Nasdaq" remains the most crowded trade.

Meanwhile, sentiment remains in check as cash levels are elevated and the biggest reason for holding extra cash is "Bearish views of the markets".  This bearish stance coincides with expectations for "faster global growth" falling to 38% in July, down from 62% in January.  Fund managers continue to lose faith in profit and earnings expectations as they sink to the lowest percentage since the US election.  Additionally, 17% say corporate balance sheets are over-leveraged, the most since April 2009. 

 Exhibit 2:  Evolution of Global FMS "most overweight global sector"5229154ce8d74d64af24807447bef23f.svg
 
  Exhibit 3:  Evolution of Global FMS "most crowded trade"
637bdb711fe94c75b5138d3e0f706a09.svg

Exhibit 6: If you are holding consistently higher levels of cash in recent quarters, does this reflect:
c9edb3c78ea0424a9ea389611eadc5b4.svg
 Exhibit 8: How do you think the global real economy will develop over the next 12 months?2eb5703955674dfe916529b3e9939829.svg

With the news that Republicans could not pull together enough support in the Senate to pass a health care overhaul this will only put more pressure on growth expectations.  Much of those assumptions had been built on the idea that growth will come with less regulations and lower taxes.  This theme could be pushed out further into the future with the failure to pass an Obamacare replacement.  Sentiment could take a hit as traders fear tax reform will not take place this year. 

The S&P 500 has now tied the second longest streak in history without a 5% pullback having gone 173 days without such a drop.  The index first notched this marker in 2006-2007.  The only longer streak was the massive 296-day span during the roaring bull market of the 90's from 1995-1996.

In a previous blog post we commented:

"Below we looked at all instances since 1990 where the NDX closed down more than 2% after having just made a new 52-week high on the prior trading day.  From the data, the very short-term (5 days) is neutral but going out further there is a bias to the upside.  It shouldn't surprise anyone if we make new highs sooner than expected.  The one caveat in the data below is many of the data points happened during the super bull of the late 90's.  If we included the crash of 87 the results are worse but it was such an outlier we chose to ignore.  Regardless we thought it was interesting enough to present." 

Since then all markets have made new highs or tested highs.  The trends remain favorable to the bulls as all moving averages are pointing strongly higher.  We still favor the trend and positioned bullishly but also acknowledge there will/should be pullbacks along the way.  With seasonality setting up for a potential increase in volatility along with the excessive length without a 5% pullback, we are comfortable being patient with some cash on the sidelines looking for better entries as we navigate earnings season.  

Friday, July 7, 2017

Now What?

Looking ahead to July:
  • Last 20 years: July ranks 6th in monthly performance with an average gain of 0.67%
  • Last 20 years: The average daily trend peaks mid-month but manages to make higher lows throughout the month
  • Last 20 years:  The July through September 3-month rolling return ranks dead last with an average loss of -0.50.
  • Since 1950:  July ranks 5th in monthly performance with an average gain of 1.03%
  • Since 1950:  If the S&P is up greater than 8% in first 6 months of the year, July has an average gain of 1.50%.
  • Since 1950:  If the S&P is up greater than 8% in the first 6 months of the year, the S&P has never finished negative for the full year in 24 instances.  The average gain for the full year is 23.43% with and average gain of 7.36% for the rest of the year. 


The stats above suggest the strength will continue and July favors the bulls.  However, it's worth noting that we are about to enter the calendar's worst 3-month rolling period over the last 20 years.  Seasonality sets the table for a potentially difficult August and September.  

An interesting chart that I found over at macro-ops was the relationship between the volatility of the Nasdaq 100 and the VIX.  Below is a ratio chart of that comparison and it's telling us that either the S&P is about to get more volatile or Nasdaq 100 volatility needs to fall as this measure has gotten too extended.


We touched on the Nasdaq 7 month winning streak in our last post and June was able to snap that streak.  Another topic we've referenced in previous posts has been the longevity of the current move without a 5% pullback.  We've now broken the record for the longest period since the 2009 bottom.  The prior record holder happened in 2014 and lasted 157 days.  The current streak sits at 167 days.


The trend obviously still sides with the bulls and the stats suggest a bullish July.  But with a historically weak August and September on the horizon and the current stretch without a 5% correction staring us in the face, there's enough ammo out there to temporarily stall the bulls.  That said, we still think any pullback will be short and shallow and should be used as a buying opportunity. 

Tuesday, June 13, 2017

Did you just miss a buying opportunity?

One of our favorite tools for getting a read on the sentiment and psychology of the market is the monthly fund manger survey (FMS) from BAML.  Below are the key takeaways straight from the monthly report:
  • June FMS shows Fed tightening at time of peaking macro momentum, high cash levels, crowded Nasdaq and record # investors saying equities “overvalued” (>1999bubble highs)
  • The FMS suggests “preventative hike” to subdue Wall St speculation best describes likely FOMC action this week; but we say too little, too late to prevent Icarus
  • June FMS cash levels up from 4.9% to 5.0% (>10-year average of 4.5%); means FMS cash too high for “Big Top”
  • Global growth expectations @ 39% vs 62% in Jan...macro momentum has peaked; so June FMS sees defensive rotation to staples, utilities + largest drop since Jun’10 in allocation to commodities
  • Fed hiking 3rd time in 6 months (after hiking once in 10 years) but contrarian bond
    bulls on rise: just 9% of FMS forecast lower/flat bond yields last Dec, now 20% do
  • 3/4 say internet stocks expensive or in bubble: 57% investors say “expensive”, 18%
    “bubble-like”, 15% “fair”, 1% say “cheap” (Exhibit 1)
  •  #1 “crowded trade” in June = long Nasdaq (jumped from 26% to 38%), #2 long EU
    equities, #3 long US/EU corporate bonds
  • But contrast with ‘99 bubble (record June FMS views of “excess valuation” not
    coinciding with fall in cash levels) shows less “irrational exuberance”
  •  And comparison with ‘99 bubble (“excess valuation” is coinciding with high global
    profit expectations) reminder that while vulnerability high, missing combo for
    immediate “Big Top” is higher yields/falling EPS
  • Contrarians sell Europe, banks, tech, buy UK, resources, commodities, bonds
We remain bullish in our thesis and this survey has some interesting contrarian data to support our outlook.  Below are a few items we wanted to highlight.  We continue to hear from pundits that this market is excessive and overvalued as a record number of investors say that equities are "overvalued."  75% say internet stocks are expensive or in a bubble even as it remains the #1 crowded trade.  However, cash levels are up from 4.9% to 5% and there was a rotation into the defensive sectors of staples and utilities.  Outside of valuation metrics we can't find many indicators suggesting sentiment is excessive.  It is quite the opposite as this remains an unloved bull market that continues to climb the so-called wall of worry.


For this market to get irrational we are going to need to see more proof in underlying data.  While Nasdaq stocks may have gotten ahead of themselves the market quickly eroded some of that confidence last Friday and yesterday.  The NDX corrected 4.5% from peak to trough in less than 2 trading days.  These types of shakeouts should be expected in a strong trend and a reminder that we aren't likely to get the slow constructive pullback that everyone wants.


Below we looked at all instances since 1990 where the NDX closed down more than 2% after having just made a new 52-week high on the prior trading day.  From the data, the very short-term (5 days) is neutral but going out further there is a bias to the upside.  It shouldn't surprise anyone if we make new highs sooner than expected.  The one caveat in the data below is many of the data points happened during the super bull of the late 90's.  If we included the crash of 87 the results are worse but it was such an outlier we chose to ignore.  Regardless we thought it was interesting enough to present. 


To include all data points going back to the inception of the NDX (1985) we looked at all 2% down days and then also compared them when they were above the 200 day moving average and below.  The data suggest strong trends persist when the NDX has a 2% down day and above the 200-day moving average (as we are now).


One thing we have talked about and continue to monitor is the length of the current move in the S&P without a 5% correction.  The S&P 500 has now gone 151 days without a 5% correction.  This is the second longest stretch since 2009 and is fast approaching the record of 155 days from Feb-Sept of 2014 since the 2009 bottom.  Nautilus Research put out a nice piece on the current streaks in the NDX and S&P that also confirm we are long in the tooth.

We know this market is extended and due for a pullback at some point.  As we witnessed with the NDX Friday and Monday these pullbacks can come out of nowhere and happen fast.  We expect it to be no different next time.  However, we are still bullish and continue to see mild sentiment as a potential catalyst for further gains.

Wednesday, May 31, 2017

Summer Pullback?

Looking ahead to June:
  • Last 20 years: June ranks 9th in monthly performance with an average loss of 0.30%.
  • Last 20 years: The average daily trend for June looks a bit choppy on the chart below with weakness typically coming in the back half of the month.
  • Since 1950:  June ranks 10th in monthly performance with an average loss of 0.05%. 
  • Since 1950:  If the prior month is positive and the S&P is up YTD, June has an average gain of 0.54%.
  • Since 1950: If the S&P is up greater than 7.5% from January through May, June has an average gain of .98%.
  • Since 1950: If the S&P is up greater than 7.5% from January through May the S&P has never finished negative for the full year in 21 instances.  The average gain for the full year is 23.43%. 


The stats above have something for everyone.   The bullish case supports that momentum will continue with the potential for full year gains to be extremely healthy.  If the year starts strong like 2017 has, that gives the chance for a positive June a higher probability.  However, as we touched on last month, May begins a seasonally weak period and the average June is historically negative.  Something we will be watching is the FOMC rate decision meeting June 14th.  Currently there is an 88% chance of the Fed raising rates at the meeting.  This could bring an extra layer of volatility into the back half of the month (which would support the historical average daily trend of June shown above).  

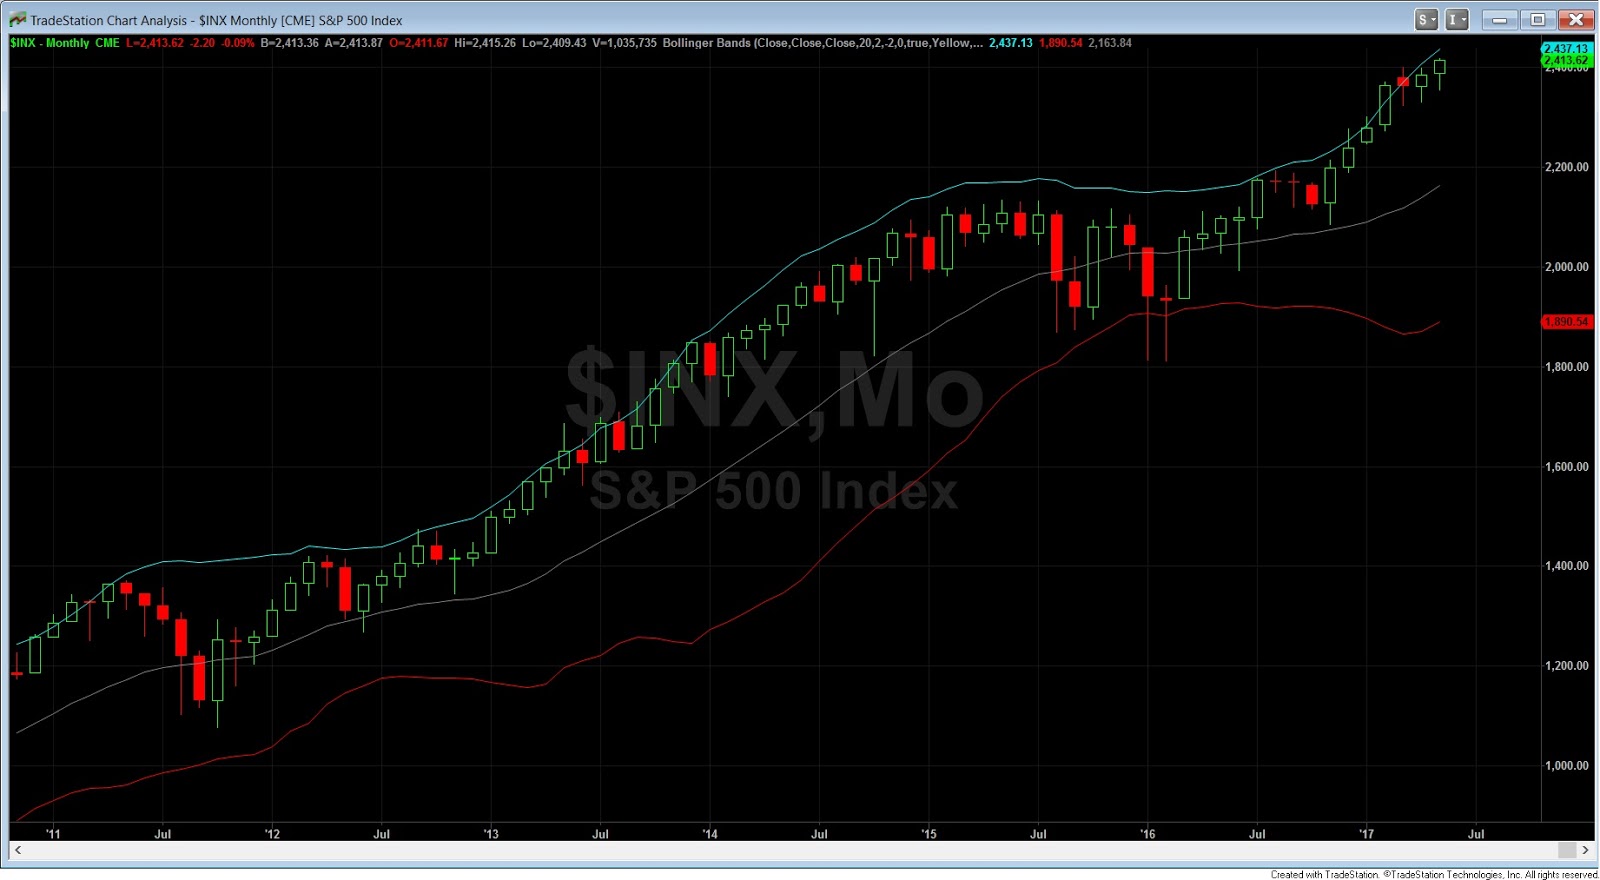
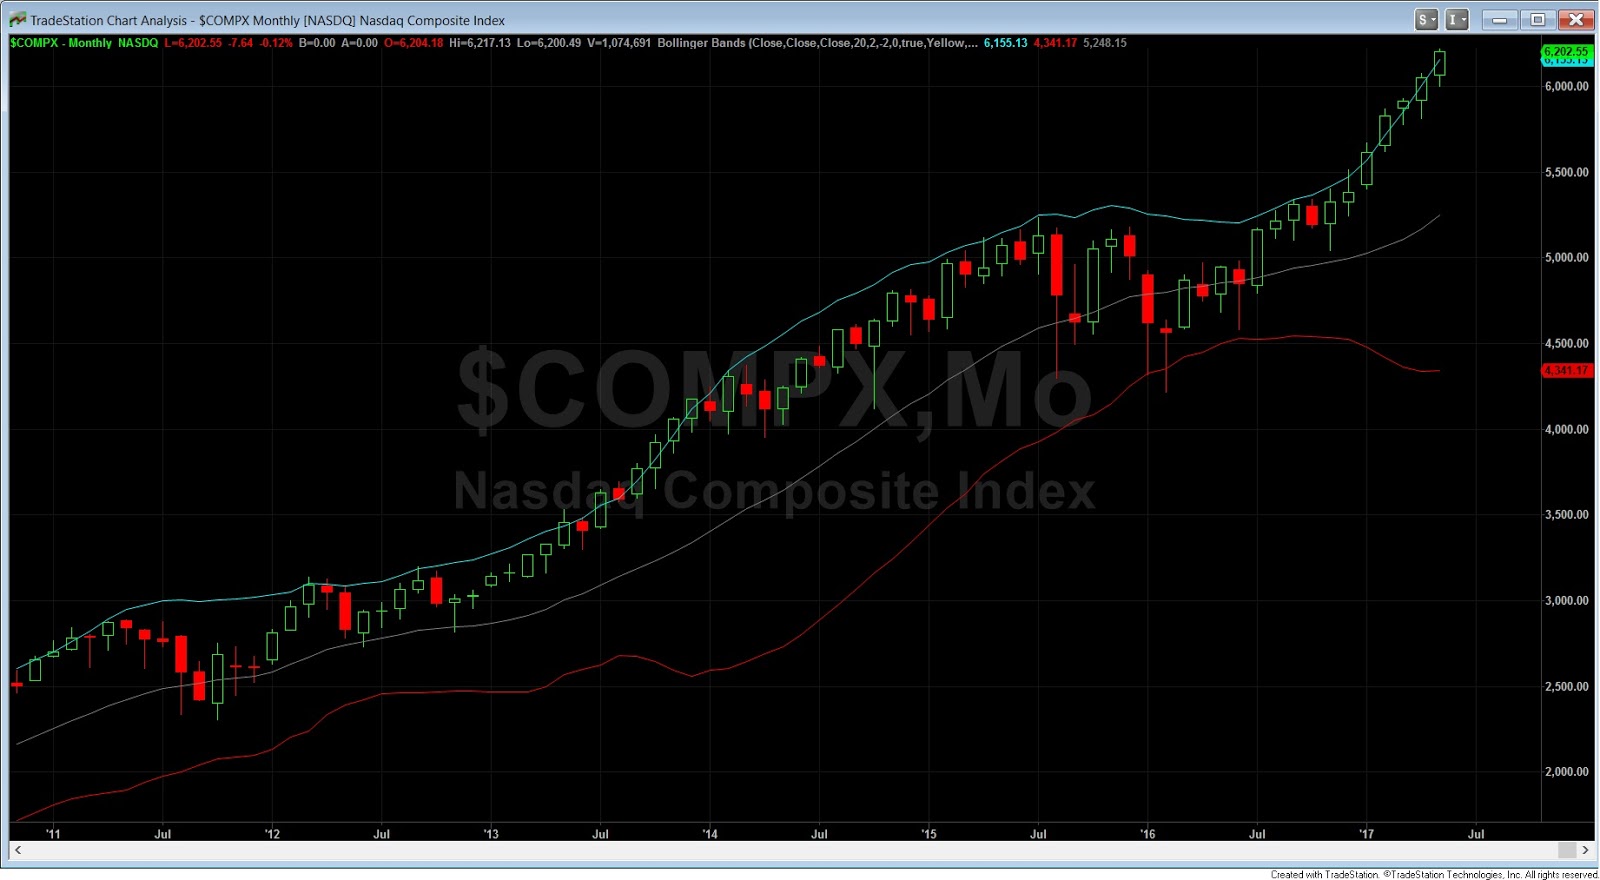
The overall trend remains very strong as the S&P and Nasdaq continue to ride the high side of their monthly Bollinger bands.  The Nasdaq is the clear leader as it has risen 7 straight months and 10 out of the last 11.  The parallels to 2013 remain as the S&P and Nasdaq traded higher for 7 straight months from the end of 2012 to May 2013 and ultimately 12 out of 14 months.  

We also looked at how the Nasdaq has traded going out 1 to 6 months after a 7-month winning streak.  The data suggests momentum will continue at a higher rate than the whole sample. 


If we look at breadth and sentiment to gauge investor appetite and psychology there are two interesting blog posts I wanted to highlight.  The fat pitch has a well written study on washouts.

"Similarly, markets have a tendency to periodically "washout." One way that can be measured is by the percentage of stocks trading over their 50-dma; a washout would coincide with a reading under 30% (lower panel). It has now been 7 months since the last washout. These streaks have extended to 8 months only twice since 2004 - in February 2007 and June 2015, leading to declines in SPX of 7% and 12%, respectively. Even the powerful 2013-14 run did not go more than 6 months without a washout in breadth."

 
Ryan Detrick over at LPL Research touched on a recent gallup poll showing that we are nowhere near the euphoric stage that is characteristic of bull market tops.   Meanwhile the CNN fear and greed index remains in neutral territory even as we make new highs. 

https://lplresearch.files.wordpress.com/2017/05/5-24-17-fig-1.png


The trend remains friendly to the bulls and patience continues to be rewarded.  Heading into the summer months, and the historically weak June, maybe we have the proper setup for a short-term correction and a potential washout in breadth.  While we expect shallow pullbacks during this bull run, trying to time them will be extremely difficult.  With sentiment readings sitting in neutral and the data supporting strength for the remainder of the year, we feel confident in staying the course.