Tuesday, June 9, 2020

New Highs?

We started our last blog with a question, is the bear over?  We highlighted some evidence that put the likelihood a bottom was established in March and suggested we could be in a 1998 environment in which the market V-bottomed and raced to new highs.  Now the next logical question is, are we in a new bull market and are new highs ahead?

What we have witnessed since the March bottom is nothing sort of remarkable.  In the face of the largest pandemic since the early 1900s, stay at home orders, worst economic numbers ever, riots and protest in all major cities, the markets have raced higher just as fast at it collapsed.  This has been the fastest transition from a US bull to bear market in history at 16 days for the S&P and 19 days for the DOW, before turning back into a bull market on April 8th.  The Nasdaq has hit new highs and the S&P is off just 5.5% from all time highs.  This is after both were down greater than 30% just a little over two months ago.  Below shows the V-bottom like behavior in the S&P and Nasdaq since the rally began in late March.  In fact, the S&P 500 just put in the largest 50-day rate of change going back to the 60s.  The next closest was coming off the 2009 bottom.  Not even the 90s has such a strong 50 day advance.  


50-Day rate of change for current market

2009 50-Day rate of change  


 1990s 50-Day rate of change


Ryan Detrick compares bear markets and the subsequent rallies in his recent tweet.  If the S&P takes out new highs in the next few months this would be one of the fastest bear market recoveries ever.

 Image

Below shows just how powerful this current rally is as it compares to the greatest rallies of all time.  

Image

The one thing that has lacked coming off the bottom has been breadth.  The market rallied on the back of narrow leadership that were deemed the winners in the work from home plays.  However, as states have slowly started to reopen breadth has exploded and participation is now broad and wide.  Currently over 90% of all stocks are trading above their 40 day moving average.  Below is a study from Ned Davis that shows the past instances (marked by arrows) where this short-term breadth indicator crossed above 90 after falling to at least 75% in between. Out of the 19 cases, the market was up a year later each time with a median return of 16.28%.


Outside of the reasonable case that the coordinated actions of monetary and fiscal stimulus have turbo charged the rally one less obvious stat caught our attention.  An interesting note from Jeffries shows the U.S. has witnessed a cratering in the number of publicly traded companies in the last two decades – a trend that doesn’t seem poised for a rebound in 2020 with capital markets’ activity declining considerably. And while net leverage has crept up from a few years ago, it remains half of what it was in the mid 1990s. Due to the growth of passives, there has also been the knock on effect of higher concentration, with five houses owning, on average and in aggregate, about 20% of many companies in the U.S.  Another way of looking at it: if the equity universe were a neighborhood:
• There would be fewer houses
• But these houses would be bigger, on average (by market cap)
• And they would be held by a smaller number of owners


On top of this, sentiment isn't euphoric even after the greatest 50 day move in the S&P.  That makes us hopeful for the trend to sustain and the bull to continue.  The most recent AAII sentiment survey shows a higher than normal level of bearishness along with below average bullishness.  This isn't wild extremes by any measure.


In the short term we don't want to be too aggressive considering we are overbought and have run so far so fast.  The 14-day RSI on the S&P just hit overbought levels for the first time since the rally started.  This isn't sell signal alone but just makes us aware that the markets are overheated in the short term.


Along the same lines, the put call ratio has collapsed from massive fear to complete complacency.  This tweet from David Larew displays the wild swings.

Image

In summary, the current rally has produced a historic move off the bottom and has started to broaden out which is bullish for a sustained advance and new highs.  Yet, in the short term we could see some give back considering the overbought nature of the markets and how fast they have run up.  The only thing I know is what I don't know.  As markets change we will revisit and adjust our plan accordingly.  Until then stay safe and healthy. 
Saturday, April 18, 2020

Is the bear market over?

It's amazing how much can change in a month.  It feels like the market has gone through a years worth of trading since our last post at the end of February.  We penned the following in our last blog:  
"For now the momentum is clearly in the hands of the sellers.  Extremes overshoot on both sides and this time will be no different.  I or anyone else has no clue when this will end.  It will end when it stops going down and I have the faintest idea of when that is.  But I do know this will pass and the best thing I can do is stay disciplined and don't panic.  Take a deep breadth and relax and let the psychology play out as nothing else matters."

What has transpired since then is like a roller coaster of emotions and price action.  We have witnessed extremes in many indicators on both ends of the spectrum.  As always, lets dive into the data to help us shape a thesis and guide our decision making process of how to navigate the current market. 

I first want to start with just the price action of the indices and compare that to prior hard sell offs in the past to give us an idea of how the current market is reacting to prior patterns.  What we know is the current market experienced the fastest bear market from all time high in history.  The next questions begs, is the bear market over already?

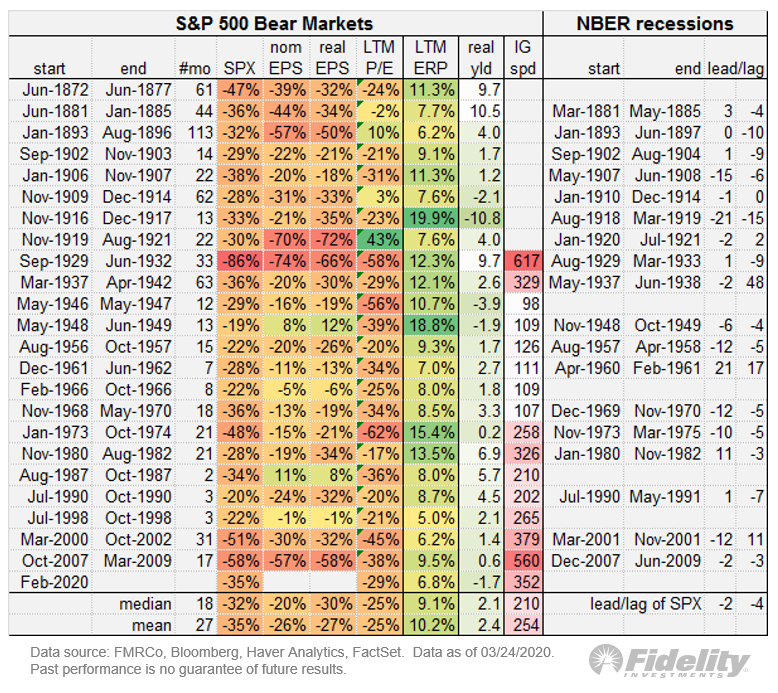
So far the S&P 500 declined 35% from highs to the 3/23/20 low which is in line with the average bear market decline all in one month.  Below are all bear markets going back to the late 1800s from Jurrien Timmer at Fidelity.

Image
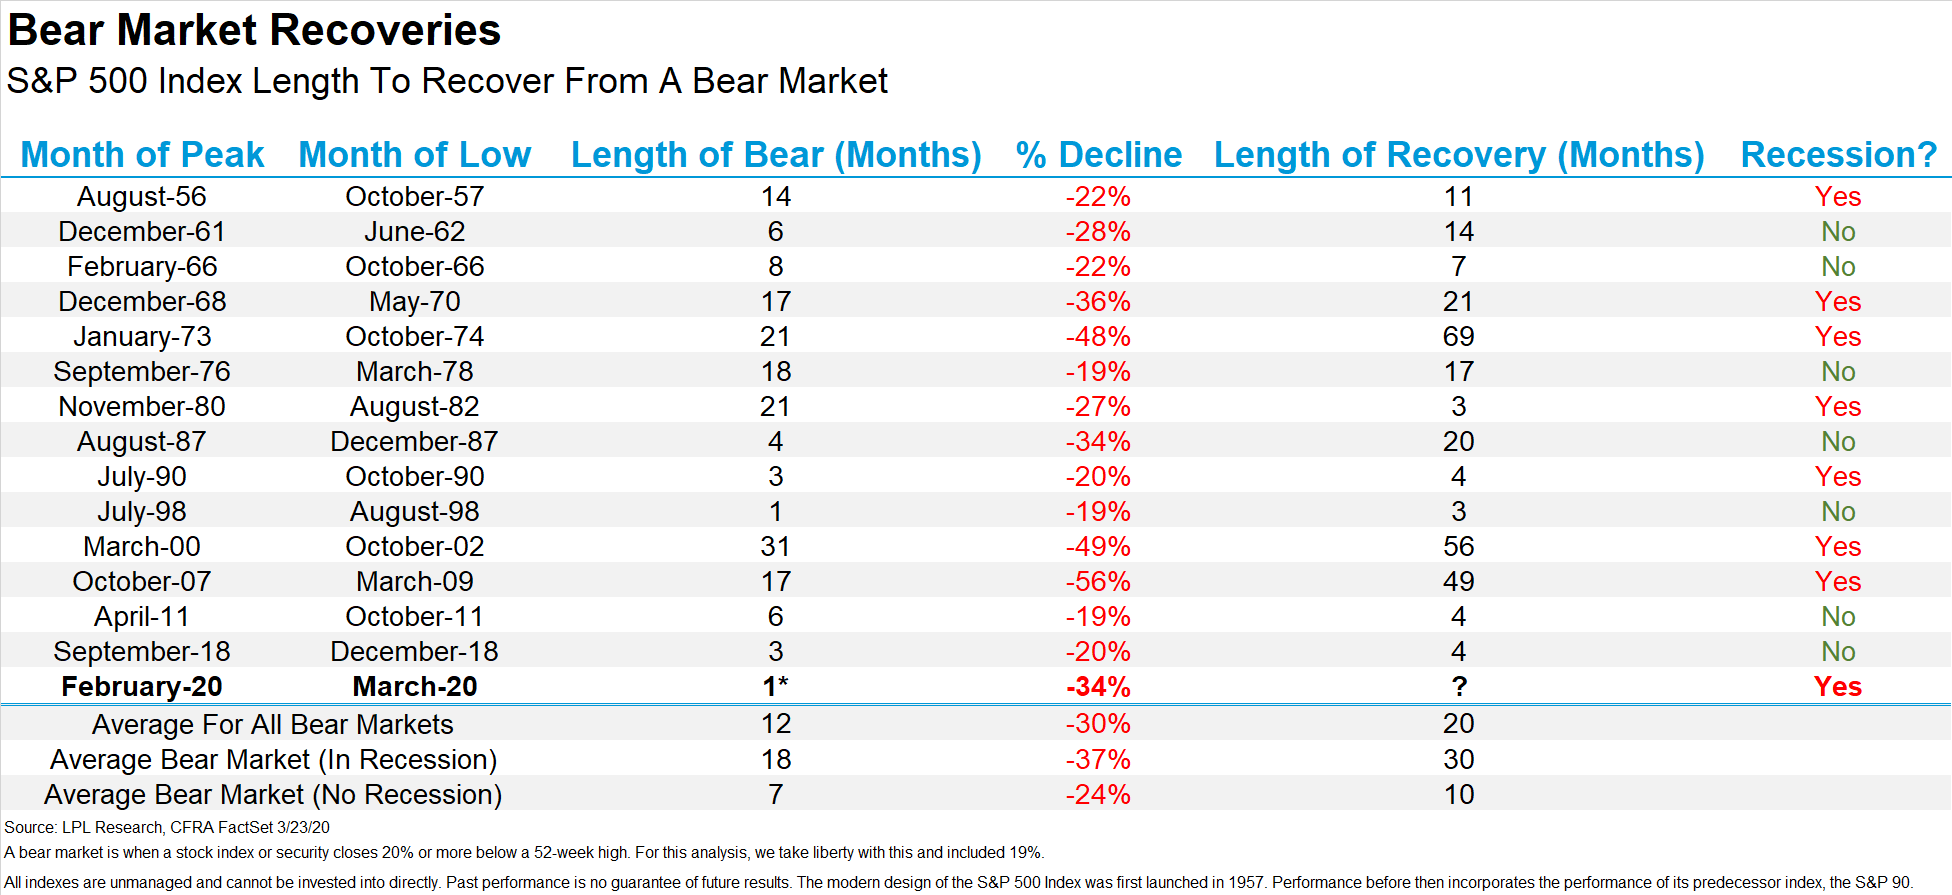
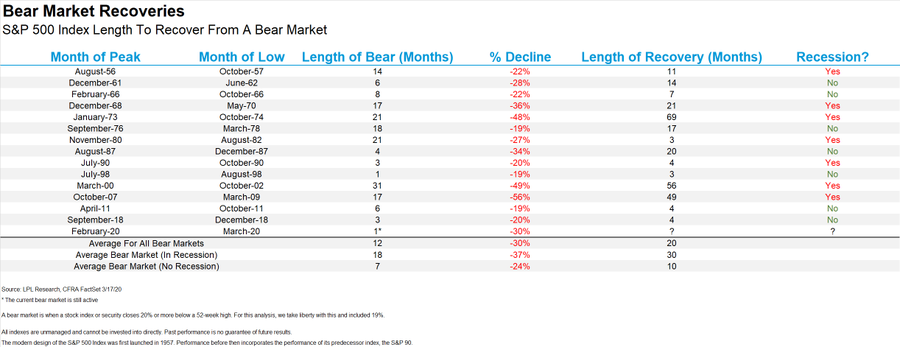
The next list from Ryan Detrick shows all bear markets since the 1950s and how quickly they recovered losses. 

 Image

From the data above we can see a certain pattern develop.  The quicker the decline the faster the recovery as was the case in 1962, 1966, 1990, 1998, 2011, and 2018.  The outlier seems to be the 1987 crash. 

Now lets turn our attention to how the VIX behaves around equity plunges.  Historically, the VIX peaks about 75 days before equity prices bottom, based on bear markets since the VIX was created in the mid-1980s.  The VIX peaked on 3/16/20 at 82.69 on a closing basis which is an all time close even higher than 2008 great financial crisis.  Add that number of days to March 16th and you arrive at a market bottom sometime in June.


Yet, the S&P has already rallied roughly 30% off the lows.  Is that enough to assume the lows were put in on March 23rd just 5 trading days after the VIX peaked?  Considering the speed of the decline we think the most appropriate comparisons are prior waterfall declines we discussed above.  In 1998 and 2018 the VIX peak on the same day in 1998 and 3 days prior in 2018.  We don't have VIX data prior to 1990 so the only other two bear markets in that time frame are 1990 and 2011.  The VIX peaked 49 and 56 days prior to the S&P bottoming.  So even though the average is 75 days it is entirely possible the VIX peaked and the market bottomed simultaneously. 

Next we'll look each waterfall bear market and look how priced rallied off the bottom and see if it leaves any clues or patterns.  Below are daily charts of each bear market with the VIX and % drawdown in the bottom half of the chart.  Once again we don't have data on the VIX prior to 1990.


Currently, the S&P has rallied right into a declining 50 day moving average and is above the 50% retracement level of the whole down leg.  

  • 1962 had a near retest and months of choppy trading below the 50% retracement level
  • 1966  had 2 months of range bound trading below the 50% level before resuming higher
  • 1987 had almost 2 years of sideways chop below the 50% retracment before resuming higher
  • 1990 had 2 volatile months once it hit the 50% retracement before quickly turning higher
  • 1998 essentially went right back to highs as quickly as the decline
  • 2011 spent 2 volatile months rallying and selling off before trending higher
  • 2018 was similar to 98 and V-bottomed
If the current market takes the path of 1998 and 2018 we should expect a quick recovery that follows a short term 20 day moving average all the way back to highs.  If the rest of the samples play out we should expect some level of range bound trading with volatile moves in both directions over the next few weeks.  So far 1998 and 2018 precedent have the most in common with the current market in regards to the VIX peaking and the market bottoming and rallying. 

The next question would be what if the bottom isn't in.  All scenarios are possible but we try and use current market data with prior patterns to increase our odds.  If the market rolls over and takes out new lows we'll have to adjust our study to include more extended bear markets of the past to identify patterns.  Presently, we are under the assumption the market has bottomed and looking at possibilities of and extended rally and how that plays out. 

One reason that gives us more confidence the market has bottomed has been the extreme readings in breadth and sentiment on both extremes.  Listed are some of the bearish extremes hit during the March plunge.

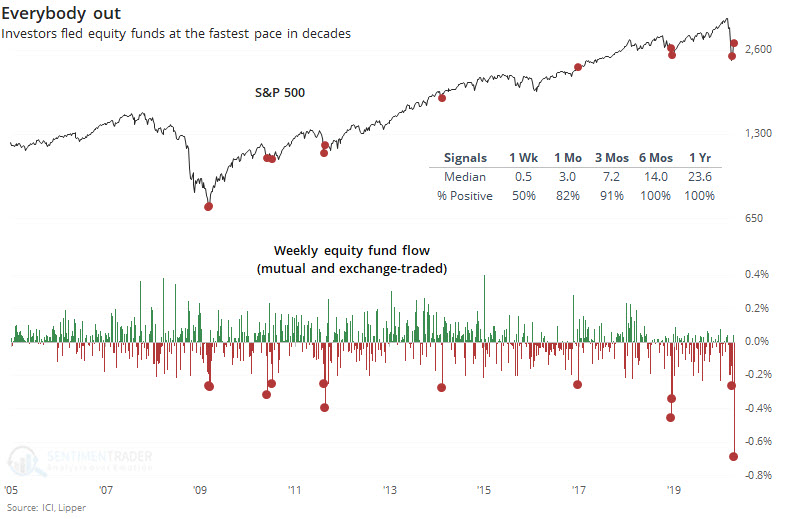
Below are from the great site sentimentrader.

This week saw an outflow from equities of more than $60 billion. That's around 0.7% of the total asset base. It's 50% more extreme than any outflow in almost 20 years, during the best week for stocks in almost 50 years.

Image


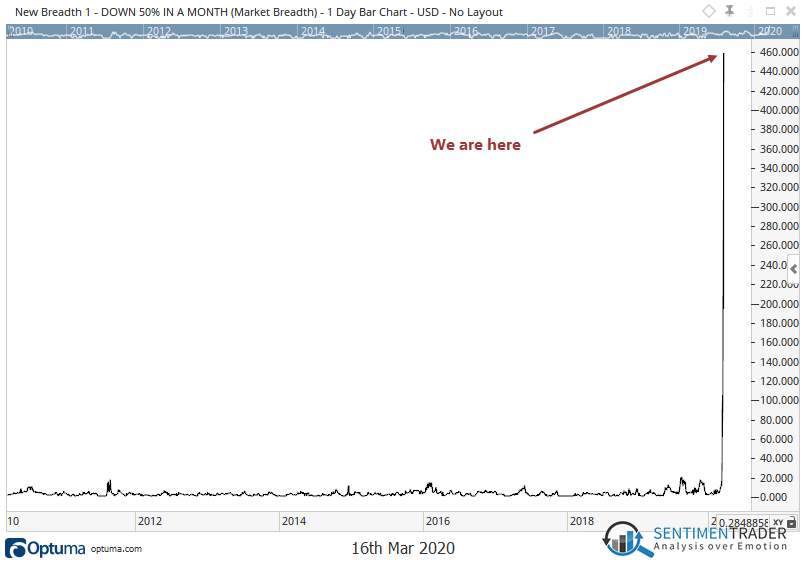
Within a month,  460 stocks in the Russell 2000 have lost half their value.  The prior high over the last decade was 20.

 
Image

Similarly, the S&P traded 26% below the 200 day moving average.  Going back to 1960 this is only the forth time it has traded this low.  The other three times were Oct 2008, July 2002, Oct 1974.


Another breadth measure we track internally is the amount of stocks down 50% or more in a month.  Historically this indicator flashes oversold readings above 20.  In fact, prior to this year the highest reading ever was 33 in August 2011.  During the 2020 crash this indicator hit 1119 showing how ugly this decline was. 


Year Max of Stocks Down 50% in a Month
2010 7
2011 33
2012 13
2013 14
2014 27
2015 21
2016 19
2017 11
2018 19
2019 24
2020 1119

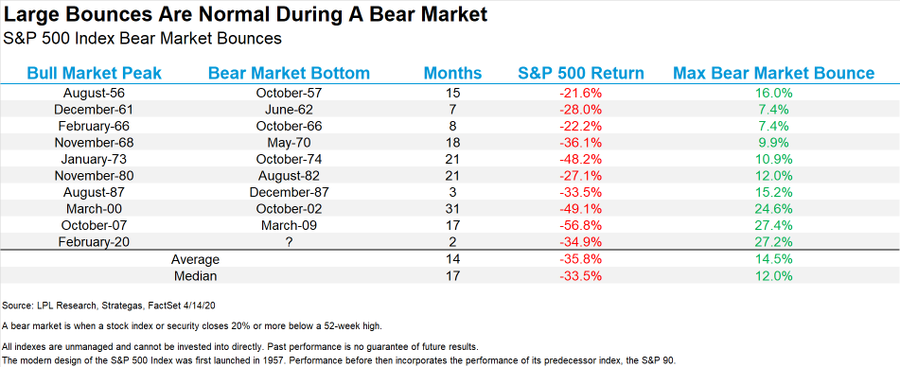
Since the market low on March 23rd the S&P has rallied 31% off the intraday low.  This rally after 18 trading days is far outpacing the bounces from all bear markets we've studied.  Ryan Detrick touched on this a few days ago in a tweet. 

Image
 
Consequently, we are getting the exact opposite of a month ago.  Indicators are flashing overbought conditions on historic proportions. 

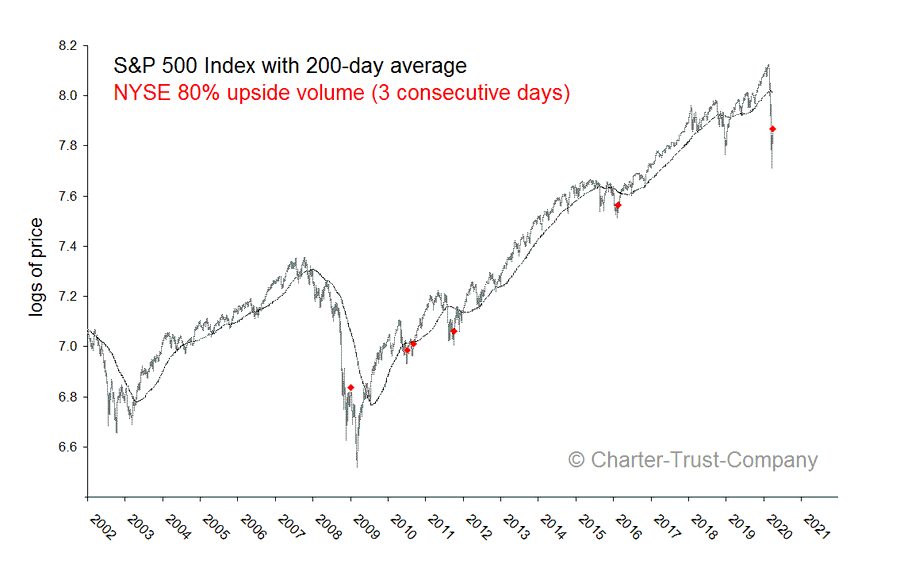
A tweet from Mark Ungewitter shows triple 80% upside days have evidenced market bottoms in 3 out of 4 cases since 2002 with a glaring exception on January 2nd, 2009. Never easy, is it?
Image
Sentiment has come roaring back as witness by sentimentrader recent tweet.

Sentiment has come back with the stock market's rally as a *RECORD* number of media stories mention "back to normal". Many of these stories are from the same people calling for another market crash at the bottom in late-March

Image

Once again the number of stocks up 50% in a month hit an all time high (144) going back to 2010.  The next closest was 80 back in October of 2011. 

Year Max of Stocks Up 50% in a Month
2010 25
2011 80
2012 40
2013 29
2014 43
2015 26
2016 73
2017 26
2018 30
2019 41
2020 144

We started this study trying to solve the question of has the bear market ended.  Our conclusion is the market has indeed bottomed.  Now we would like to know how the rally will transpire.  I wish I had a crystal ball but unfortunately we don't have that gift.  Based on the evidence above there are multiple scenarios how it all plays out.  From rallying straight back to highs in a V-bottom, to violent volatile swings, or months of range bound action.  So far the playbook most resembles the 1998 market.  It is never easy but if that precedent holds we should expect more gains in the months ahead. 

Friday, February 28, 2020

Nothing Else Matters

You can't turn on the TV without seeing headlines of the biggest down day ever or fear of the coronavirus.  Right now emotions and headlines are driving the markets.  During panics, nothing else matters besides psychology.  You can throw out PE ratios, valuations, fundamentals, sentiment, etc.  Once emotions take hold, markets tend to act irrationally and that can last longer than expected.  The fact that the S&P has corrected roughly 15% off recent highs shouldn't shock anyone.  The average intrayear drawdown is 14%.  What has been so surprising is the speed of this move.  In fact, this is the fastest stock market correction ever.  Below are some data on the current pullback. 

A tweet from Michael Harris shows how rare this move is.


Charlie Bilello says that 7% of stocks in the S&P 500 closed above their 50-day moving avg, lower than 98% of historical data back to Dec '01. Other periods in extreme oversold zone (bottom 2% of readings)... July-Aug '02 Aug '07 Jan '08 Oct-Dec '08 March '09 May-Jul '10 Aug '11 Aug-Sep '15 Dec 2018-Jan '19


This sell off has seen sentiment go from opposite extremes in quite a short period.


One bit of conflicting data is the usual flight to quality investments are getting hammered today.  Gold, silver, utilities, and cryptocurrencies are all down.  Meanwhile, semi's and oil and gas names are flat to positive.  The only real place to hide are good old US treasuries.  They have been the best hedge against equity weakness.  Maybe just maybe, we are starting to see some positive divergence in some sectors and the market is looking to find a short term bottom.   

The good news is the returns going forward after sharp mean reversion is usually pretty bullish.

Nautilus Research shows the forward returns after an excessive move in volatility.


Another good study from Charlie Bilello shows the S&P 500 forward returns following bottom 2% of historical readings.


No one has any clear answers on how much further the coronovirus will spread.  I can say with certainty that news will make matters worse as the media loves selling fear.  The fact that the economic impact is so unknown is the scary part considering the speed of transmission of this virus.  Yet, data below from Jeroen Blokland is a positive data set in an otherwise gloomy news cycle.  The number of new recovered cases (green) has been bigger than the number of new confirmed cases (red), and the gap between the two is increasing!


For now the momentum is clearly in the hands of the sellers.  Extremes overshoot on both sides and this time will be no different.  I or anyone else has no clue when this will end.  It will end when it stops going down and I have the faintest idea of when that is.  But I do know this will pass and the best thing I can do is stay disciplined and don't panic.  Take a deep breadth and relax and let the psychology play out as nothing else matters.

Tuesday, January 21, 2020

Euphoric?

After the recent performance off the October lows many market participants are labeling this market euphoric.  While we believe the market is extended, the evidence doesn't point to a euphoric market just yet.  The most recent Bank of America (BAML) fund manager survey gives us a good glimpse into investors sentiment and positioning.  Below are the key takeaways from the January survey.


While investors allocation to global equities has risen from net 12% underweight to net 32% overweight since August 2019, the biggest jump in equity positioning since 2011, but still below teh net 50% overweight level consistent with prior market tops. 

Cash levels are still not supportive of a blow off top.  There still remains cash on the sidelines that can be sucked into the markets. 

 Another signal that we are not at euphoric levels just yet. 


The 2020 election in November will be the biggest macro theme throughout the year and why it is considered the biggest tail risk. 

As we see below investors have positioned money into Europe and Emerging markets, favoring these regions over US equities. 


The S&P remains extended and overbought.  However, this market was overbought starting in November as the 14-day RSI has been consistently above 70 since then.  A strong tape can remain overbought longer than expected.


The S&P has gone almost 4 months without a 3% pullback.  While this is historically long in the tooth, the market has experienced rallies without pullbacks longer than usual.  As recent as 2017 the S&P went almost 10 months without a 3% or greater correction. 


Sentiment in the short term remains complacent and greedy.  With the VIX trading sub 13 and the CNN fear and greed index flashing excessive levels sentiment is stretched. 

The data presented shows a market that is elevated and overbought.  While we believe in the short term the risk reward isn't great at current levels, there is still plenty of runway before investors get really euphoric.  A pullback would be welcomed considering the strength of the rally from October but it isn't a prerequisite for this market to head higher. 

Tuesday, December 10, 2019

Rounding out a decade

2019 is shaping up to be one of the best years for asset class returns.  It is a mirror image of last year in which every asset class except cash posted a negative return.  We have talked a lot about how strength begets strength and that has proven consistent all year long.   As we enter the final few weeks of the trading year there is no shortage of bulls and bears as we turn the clock on a new decade.

We remain in a favorably bullish period for the markets (Nov-April) and December is one of the best months of the year with a 1.50% average gain while finishing higher almost 74% of the time.

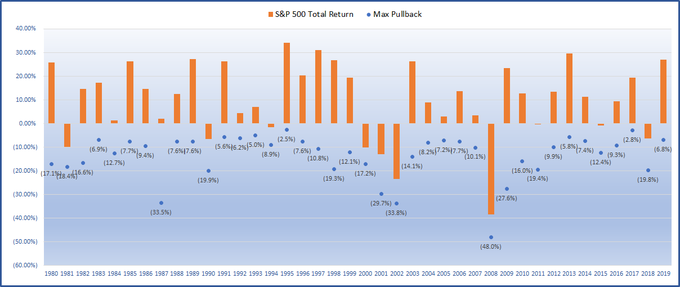
Not only has 2019 been a great year for the equity markets it has also been one of the least volatile.  According to Ryan Detrick, "the S&P 500 has pulled back 6.8% from peak to trough in 2019. This is actually one of the smallest pullbacks we've seen in recent memory."

Image 

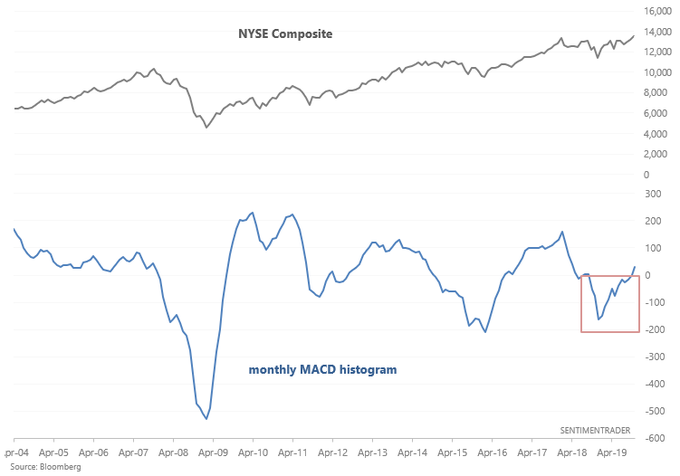
A great study from Sentiment trader trader shows the MACD indicator setting up bullish for stocks the next year.  Monthly MACD's are now turning positive for the Dow and NYSE Composite for the first time in >1 year. This is bullish for stocks on a longer term basis. When this happened in the past to the NYSE Composite, stocks went up 100% of the time 6-12 months later.

Image

As we embark on a new decade we also enter the 4th year of the presidential cycle.  Nautilus Cap does great cycle work and below shows the S&P seasonal composite for the forth year of the election cycle which shows first half volatility follow by a resumption of the trend and strong close to the year. 

Image 

On thing that has been missing from this market is complete market participation.  As equity indices hit new highs the amount of stocks hitting 52 week-highs is non existent.  In fact, more stocks are hitting new 52-week lows.  Meanwhile the A/D line supports the trend which is encouraging.  This all amounts to mixed signals from participation.  We can see from the chart below the A/D line in yellow is confirming the strength in the NYSE Composite while new highs total just 19 and are strongly outnumbered by 106 new lows.


If breadth is to confirm the strength in equity market it will need participation from small caps.  They have trailed the larger cap indices all year but are starting to gain traction.  Even though the Russell 2k remains below all-time highs posted in 2018 it did make a new 52-week high recently.  If you are buying small caps you are making a bullish bet on domestic growth in 2020.  If the economy avoids a recession, which we think is likely, and the economy accelerates, small caps will be a good bet.  Economic recoveries “tend to be the best phase for small-caps,” says Jill Carey Hall, an equity and quant strategist at Bank of America Merrill Lynch. “That’s one key reason we think we could be poised for a shift from large to small.” Small-cap outperformance is one of Bank of America’s biggest bullish predictions for 2020, strategists there said this past week.


When it comes to the economy, there is plenty of supporting data for growth to resume in 2020.  There has been no earnings growth this year.  According to FactSet, Q1 earnings were down 0.2%, Q2 earnings were down 0.4%, and Q3 earnings were down 2.2%.  In fact, it will market the first time in 3 years of three straight quarters of year over year earnings declines since Q4 2015 through Q2 2016.  Yet, equities are trading at all time highs.  Why is that?  Typically, equity prices are forward looking.  The most recent jobs report just printed an unemployment rate of  3.5% which is a 50-year low coupled with a surge in jobs.  With an accommodative Fed keeping interest rates low along with the good news for the US labor market in the November employment report could help validate the acceleration in the economy and earnings picture in 2020.  


Something to keep an eye on and one the bears will point to is valuations.  The US is one of the most expensive markets in the world based on P/E ratios.  Alex Barrow from Macro Ops highlighted this in his recent weekly update.  "Looking further out though into 2020 the SPX is going to be fighting some decently strong headwinds in the form of stretched valuations absent a visible driver of earnings growth. The below chart from Goldman Sachs shows the year-to-date rally has been almost entirely driven by valuations rerating higher. Over the longer-term, this is unsustainable — especially in the US where valuations are already high. Either earnings growth will need to pick up materially or equities will hit a wall."


These lofty valuations has Morgan Stanley lowering expectations for the next decade.  Morgan Stanley expects the opposite for the next 10 years, as it sees valuations and returns reverting to their means. Translated, today’s high stock prices point to low future equity returns. Low bond yields necessarily mean lesser fixed-income returns. Moreover, taking on bigger risks also isn’t likely to pay off in bigger returns, the investment firm adds. “We estimate the average 60%/40% stock/bond portfolio will return only 4% to 5%, roughly half that of the past decade,” writes Lisa Shalett, chief investment officer at Morgan Stanley Wealth Management, in a client note.

As markets embark on new highs, lets check in on sentiment.  Considering the recent strength from the October lows we would expect to see overheated levels.  The CNN fear and greed index is flashing greed but is not overly excessive. 


More supporting evidence that we could get a year end rally is the NAAIM Exposure Index which represents the average exposure to US Equity markets reported by active managers.  It is elevated but still well below 2019 highs as markets sit at yearly highs. 


In summary, if earnings and economic growth accelerates in 2020 higher valuations can be justified with the low interest rate envrionment.  However, if said growth doesn't materialize the markets could be in for a volatile ride considering what they seem to be pricing in. 


Monday, September 30, 2019

Ocotber and the 4th quarter

As we head into the 4th quarter we wanted to look at the potential for the year end.  Historically, October has been associated with volatility.  In fact, since 1950 October ranks as the most volatile month with the highest draw down and draw up of any month.  From a return perspective, October ranks in the middle of the pack.


When we look at the daily trend for October it starts slow but finishes strong.  Below is the average daily trend for October for the last 20 years.  


In prior posts we have talked about how a strong start to the year typically is followed by strength till year-end.  However, a tweet by Ryan Detrick shows how the next few months could be choppy. 

Just wanted to highlight the potential for an increase in volatility as we head into the 4th quarter.