The site is temporarily under construction. We will be back up and running December 5th.
Friday, November 14, 2014
Thursday, October 16, 2014
Conflicting Signals
In our post about Flexibility, we posted that successful investors are able to sift through a constant flow of data and synthesize it in a way that aids their trading style. Oftentimes however, the data flow can become so heavy and overwhelming that it becomes self-defeating for even the best traders. For instance, when the market enters super volatile, choppy periods or undergoes a trend change, the data flow can easily lead to indecision and second-guessing.
You don't need us to tell you that the market has set up shop in one of those volatile phases for the time being. It is whipping around with zero regard. Wednesday marked the 7th day in a row in which the S&P 500 moved more than 1%. That hasn't happened since 2009. The S&P was down nearly 60pts during mid-day and we saw the Nasdaq fall as much as 100pts and climb all the way back to flat during the last hour of trading. Yet somehow, the Russell 2000 was up 1% for the day. Clearly, this is no market for being stubborn or stiff.
The conflicting signals being thrown at us demand flexibility. Here are a couple that have us appreciating the importance of risk management and the flexibility to move to the sidelines...
The last time the VIX has had a similar move was the sell off from March-June 2012 in which the S&P 500 lost almost 11% from peak to trough. The current moves in the VIX and S&P are near these levels now. Will the market hold these lows or are we entering a more volatile period ala 2011 in which the VIX exploded into the 40's and we had a 20% market drawdown?
 |
| Chart created using TC2000 |
On a positive note money continues to favor small caps as they have outperformed to upside the last few days versus large caps. Over the last week, the Russell 2k is actually positive while the S&P, Nasdaq, and Dow have all had loses greater than 3.5%. We find this as a potential positive as small caps have lead to the downside and are now are attempting to lead to the upside. A welcomed divergence. Another positive breadth measure is the % of stocks above their 10, 20, and 50 day averages in the IWM has been moving steadily higher as the index was hitting new lows.
 |
| Chart created using TradeStation. ©TradeStation Technologies, 2001-2014. All rights reserved. |
With the information flow so mixed right now, one should be content to be patient and allow the market to tip its hand on the direction of the next sustained trend.
Wednesday, October 15, 2014
Flexiblity
As we've mentioned before, we're big promoters of the K.I.S.S. philosophy. We're certain that we're not the smartest people in most rooms so we strive to keep our process streamlined and uncomplicated in order for it to best fit our personalities.
However, we as traders must look at a ton of data. Sometimes an overwhelming amount and that's when things can quickly go from simple to unnecessarily complicated. All the data in the world won't do us any good unless we're processing it correctly and using it to either confirm or reject potential outcomes.
Dr. Brett Steenbarger recently had another really insightful post on his Traderfeed blog. In Fluid Reasoning and Making Decisions the Right Way, Dr. Steenbarger observes that success is not so much a matter of making the right decisions, as it is making decisions the right way: fluidly, placing current observations into broader context.
We're often looking at the exact same data as other investors. There's only so much available and advances in technology have pretty much leveled the playing field. However, those that can process information properly and have the ability to be flexible in their thinking are often set to outperform the crowd.
To have continued success in trading, one must be willing to adapt as the markets are dynamic and expected outcomes can change rapidly. An earnings report or economic number can change the shorter term trend while something like Ebola, war, or recession can have huge repercussions longer term. While we have no clue if/how something like the current Ebola threat might impact the market's direction, it is something that we must account for. This is all part of staying flexible within an ever changing market and world.
Thursday, October 9, 2014
George Washington University - Student Investment Fund
In recent weeks, we've had the fortune of participating in a series of events put on by the George Washington University School of Business. They focused on the management of the school's Ramsey Student Investment Fund and the students that oversee this endeavor.
The Ramsey Fund is a $2.4 million portfolio within the University's larger endowment fund. Business school students enrolled in the University's Applied Portfolio Management course are charged with the day-to-day management of the fund and tasked with identifying the securities in which to invest. The course is steeped in the Buffett-Munger-Graham investment philosophy and approach and its "textbooks" include The Intelligent Investor, The Essays of Warren Buffett and Security Analysis. The course is entirely intended for students seeking careers in investing, portfolio management, financial analysis, etc.
We met the Applied Portfolio Management course lecturer, Rodney Lake, at a conference this summer and he was eager to pair the Ramsey Fund students up with industry folks in the D.C. area. He realized that while our strategy and investing style is very different from the deep-value orientation of the Ramsey Fund, we did share the core beliefs of strict discipline, repeatable processes and risk management.
Ryan and I agreed that collaborating with the GW group would be a rewarding experience for all parties involved. It wasn't all that long ago (ok, it's pretty far in the rearview at this point) that we were clueless college kids with zero hands-on money management experience. And that is such a silly notion when looked back upon. Why wouldn't all students training to become money-managers be given some real-life experience over the course of their education? In our opinion, the burden of having "skin in the game" whether that be real dollars or a course grade could significantly alter their learning experience.
The headline event was the 8th Annual Ramsey Student Investment Fund Conference during GW's alumni weekend. In addition to providing the GW community with investing insights, highlights of student achievements and student-led stock pitches, the event featured a keynote address by Julie Monaco, Managing Director, Global Head Public Sector, Corporate and Investment Banking Division at Citi. Ms. Monaco spoke on the investment trends her group is seeing specifically within the construct of the world's largest pensions, central banks and sovereign wealth funds.
It has most definitely been an enriching endeavor thus far and we hope to continue assisting the GW School of Business in any way we can.
Cheers!
The Ramsey Fund is a $2.4 million portfolio within the University's larger endowment fund. Business school students enrolled in the University's Applied Portfolio Management course are charged with the day-to-day management of the fund and tasked with identifying the securities in which to invest. The course is steeped in the Buffett-Munger-Graham investment philosophy and approach and its "textbooks" include The Intelligent Investor, The Essays of Warren Buffett and Security Analysis. The course is entirely intended for students seeking careers in investing, portfolio management, financial analysis, etc.
We met the Applied Portfolio Management course lecturer, Rodney Lake, at a conference this summer and he was eager to pair the Ramsey Fund students up with industry folks in the D.C. area. He realized that while our strategy and investing style is very different from the deep-value orientation of the Ramsey Fund, we did share the core beliefs of strict discipline, repeatable processes and risk management.
Ryan and I agreed that collaborating with the GW group would be a rewarding experience for all parties involved. It wasn't all that long ago (ok, it's pretty far in the rearview at this point) that we were clueless college kids with zero hands-on money management experience. And that is such a silly notion when looked back upon. Why wouldn't all students training to become money-managers be given some real-life experience over the course of their education? In our opinion, the burden of having "skin in the game" whether that be real dollars or a course grade could significantly alter their learning experience.
The headline event was the 8th Annual Ramsey Student Investment Fund Conference during GW's alumni weekend. In addition to providing the GW community with investing insights, highlights of student achievements and student-led stock pitches, the event featured a keynote address by Julie Monaco, Managing Director, Global Head Public Sector, Corporate and Investment Banking Division at Citi. Ms. Monaco spoke on the investment trends her group is seeing specifically within the construct of the world's largest pensions, central banks and sovereign wealth funds.
It has most definitely been an enriching endeavor thus far and we hope to continue assisting the GW School of Business in any way we can.
Cheers!
Wednesday, September 24, 2014
Observations on the Russell 2000
We're big believers in agenda-free investing. It's important that investors be aware of their biases and avoid "forcing" trades because of them. When we look at data and trends, we're hoping to determine the potential scenarios the market is offering us while not becoming married to any single prediction/outcome. Yet from those scenarios, we believe we can make more informed decisions and better define our risk when making our next directional trade.
With all the talk on divergences and death crosses, I wanted to touch on the recent weakness in the Russell 2k and some observations. The death cross (50 day moving average crossing below the 200 day moving average) that is happening in the IWM lacks a clear historical edge to the downside. This can be seen with the useful study shown below (from Ryan Detrick Russell 2k Death Cross). We can see that while near-term returns skew to the downside, intermediate (3-month to 1-year) performance is meaningfully positive the majority of the time.

However, what worries us is the clear divergence between small caps and large caps. The folks at Nautilus Research (@NautilusCap) help sum this up with the data shown below. It looks at the instances where the S&P has proceeded to climb (up > 5% in a 6 month period) while the Russell is retreating on a relative basis (RTY/SPX Declines > 10% over the same 6 month period). To summarize, the data portends to the Russell and the S&P struggling over the next couple of months and considerably underperforming relative to their historical trajectories.

Lastly, in our quest to keep it simple, a long term price chart of the IWM is what concerns us most. If this long term up trend-line breaks to the downside we could be in for more pain and a much larger correction. Since the beginning of the bull market in 2009, this trend-line had only been touched twice prior to this year (October 2011), (November 2012). In 2014 alone we have tested this significant support 3 times. This is something we are watching closely and its resolution will assist in understanding the scenarios the market is currently offering.

Monday, September 22, 2014
More on Divergences
Research from Lowry's states "The Advance-Decline Line has been a very important tool in measuring the forces of Supply and Demand at work in the stock markets for more than 80 years. In fact, of the fifteen major bear markets (defined as those generating losses of -20% or more) occurring in the 80 years between September 1929 and March 2009, thirteen of the fifteen cases (86.7%) were preceded by several months of significant negative divergence between the Dow Jones Industrial Average and the NYSE Advance-Decline."
The challenge with this type of research is that only in hindsight does it make perfect sense. In real-time, however, it becomes an entirely different exercise. Case in point take the take the 1973 top in the DOW in which the market then tumbled close to 47% until the December 1974 bottom. The A-D line topped out in mid-1971, just about a year and a half before the Dow put in its high.
Based on the numbers a negative divergence in the AD line gives a high probability of a market top (86.7%). However breadth divergences can just as easily resolve to the upside. A good example is the recent action in the S&P. We had a divergence in the A-D line vs price highs in the S&P for over 6 months (6/13-1/14). However, the S&P never corrected and the A-D line eventually made new highs along with the general markets.
 |
| Charts from Tradestation |
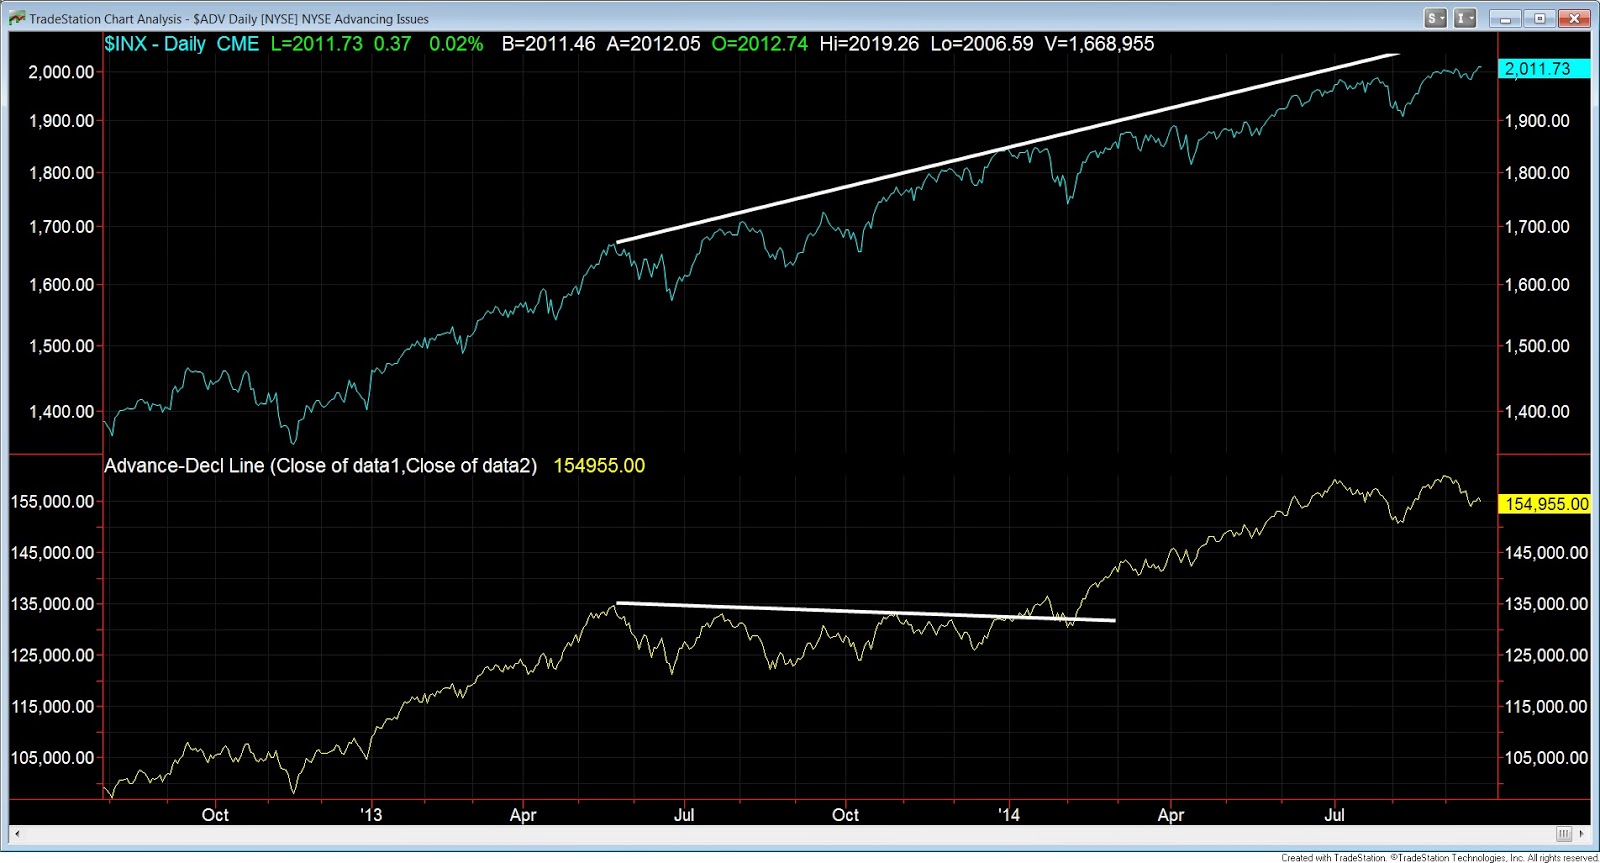
What is difficult is trying to use this data as a timing device as divergences between breadth and price can last months and in some cases years. However it doesn't mean they are useless. Its just part of the process to shape the direction of the market and keep the possibility of a top in mind.....
What is useful to know is that almost 87% of all major tops have showed this divergence. So if and when we do get a top perhaps this will have been one of the market's "tells". Along those lines, the Nasdaq is currently showing a major divergence. Only time will tell.

Friday, September 19, 2014
Divergences - What are they telling us?
As mentioned in our first post, we're big believers in the KISS philosophy. Keep It Simple Stupid. Within that framework, we are in constant search of the most relevant information available to both support and, more importantly, challenge our investment decisions.
We look at a ton of data. And we can look at it until we're blue in the face but quite frankly unless we're processing that data properly and fairly, we run the risk of using it to confirm any biases we may be carrying. It's impossible to have a perfect record in this regard but it's something we constantly challenge each other to manage.
The massive divergences taking place in the markets have brought about a flood of charts and articles across our desks lately. Concerns over breadth and leadership seem to have everyone positioned with one foot already out the door. One of our favorite resources, Dr. Brett Steenbarger's Traderfeed blog, touched on this topic on Wednesday (Breadth Weakening) and one could certainly allow the story told in these data points to dictate the posture of their portfolio.
Yet for all the negative divergence warnings we've been seeing, here's one we see as a potential major positive. After some recent periods of weakness are financials about to lead the market? Over the last month the strongest sectors have been brokers, banks, regional banks, and financials (chart by Telechart). The relative strength of the XLF vs the S&P 500 is breaking out to 3-month highs.

This is in conjunction with the rise in yields. We'll be watching this action closely as money appears to be aggressively rotating into these sectors. To make things even more confusing, Financials leadership has historically been more characteristic of an early stage bull.
As always, the market seems far more interested in making us look stupid rather than helping us keep it simple....

Subscribe to:
Posts (Atom)