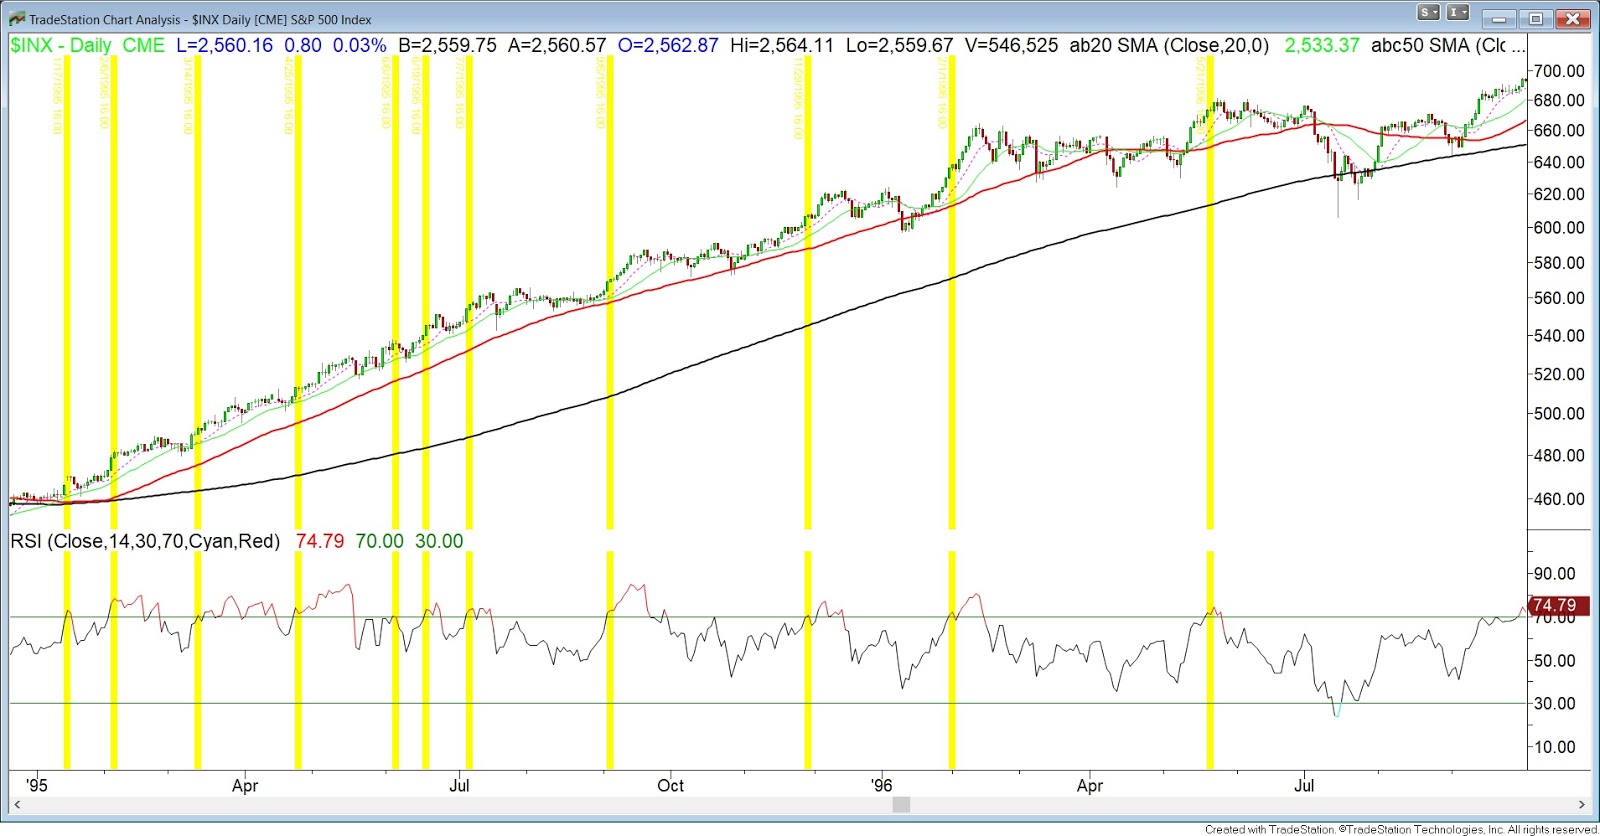
This is a question we are constantly asked and one we find the hardest to answer. If we knew every time the market was going to pullback we wouldn't be writing this blog, instead we would be counting our dollars. What we attempt to do is weigh the evidence presented and trust our research while making educated bets. We wanted to start with a simple picture of the current landscape and move on from there.
Below is a chart of the S&P with a simple 14 day RSI. We know from historical data that an overbought RSI doesn't necessarily mean we are due for weakness. In some instances it is forecasting future strength and in other cases it anticipates potential pitfalls. The data going back to 1960 shows no statistical edge going out a few weeks or months trying to predict an overbought RSI. In previous posts we have referred to prior strong trending years for comparison purposes. We still believe these to be true and why we are highlighting this below. 1995 was one of the strongest trending years in recent past and we can see that the RSI stayed overbought for much of the year while the S&P trended higher. The 2013-14 market had multiple instances of an overbought RSI all the while the market trended higher for months. This year is shaping up much in the same fashion as these two years. What we have noticed is that in most cases when the 14-day RSI became overbought the S&P went on to consolidate or pullback in the near future. As with any indicator it is not full proof but it is something that we watch and heightened our risk metrics.
Next we wonder if the S&P has broken out to the upside from its 12 month ascending wedge pattern. The path of least resistance is higher and if we do get a pullback we'll be watching the top of that channel for support. What we don't want to see is a hard sell off back into the range causing a failed upside breakout. This could lead to a longer consolidation.
Another useful tool is the monthly fund manager survey (FMS) from
BAML. It always offers an interesting view on the global investing
landscape and is a good barometer of current market sentiment. Below are the key takeaways that we focused on.
One data point that backs up the case for a potential pullback is that global equity overweight suggests risks ahead for stocks. With global equity net overweight now at +45% this has historically coincided with equity underperformance versus bonds & cash over the next 3 months.
Fund managers are positioning themselves for higher rates as just 3% of investors think global bonds will be lower in the next 12 months. 82% say bond yields will rise and a record 85% say bonds are overvalued. The rotation into banks (biggest in 3 years) and Japan while selling utilities, emerging markets, healthcare, and bonds is evidence managers expect higher yields ahead.
Cash has fallen to 4.7% but still remains high as this is a catalyst for shallow pullbacks. Managers are waiting for any dip to put cash to work.
Through all of our research we continue to conclude the general markets remain in a secular bull market. One of our thesis was the strong backdrop of our economy coupled with growth in earnings is what is propelling equity markets higher. Below supports our opinion as the expectation for macro "Goldilocks" (above-trend growth, below-trend inflation) is at record highs. It is the first time since March 2011 this exceeds investor belief in below-trend growth & inflation as the driver of financial markets.
In summary with the current overbought conditions along with global equity overweight we are mindful for a potential pullback/consolidation at any moment. Yet with cash levels still high to support dip buyers and a stable and growing economy the bull market is alive and well. To strengthen the bull case we are entering a seasonably strong period in the market that we discussed in our last blog. With earnings season upon us, we'll be looking to put cash to work in fresh new ideas but not chasing strength blindly considering the current outlook.
Ryan Worch (Graduate of Virginia Tech - Pamplin College of Business) of Worch Capital documents the daily sights and sounds we observe in the capital markets
Wednesday, October 18, 2017
Wednesday, October 4, 2017
A look to the 4th Quarter
Looking at October data:
We have a lot of data to sort through to shape a thesis heading into the fourth quarter. Clearly there is a bias to the upside as Q4 is historically the strongest quarter by far with an average gain of roughly 4% and higher 79.1% of the time. Also since 1950, the October to December 3-month rolling average is the second best streak only behind the very favorable Nov-Jan period. A nice stat courtesy of Steve Deppe via Wayne Whaley states:
"The S&P has been positive in each of the last six months. Since 1950, there have been 19 previous occasions of a down month and then six consecutive positive months and in all 19 of those setups, the S&P was higher either six of twelve months later, suggesting per this one study, that the odds of a Bear Market in the next 12 months is small."
To throw a wet blanket on all the good data, if we look at how the average October fares after a solid start to the year we get some conflicting signals. We wanted to see how October returns looked when the S&P was up greater than 10% year-to-date and September was positive which are the exact conditions heading into this October. The average monthly return for October is a loss of -0.78%. If we add that September made a new all-time high then October returns 0.33% which is well below the average October from the stats above. However, it finishes strong with a gain of another 6.39% for the rest of the year.
So how do we use this data to position our portfolios? The quantitative data from a seasonality point of view is just one in many data points that goes into our overall thinking but it certainly helps to frame an outlook. Let's take a look at some other measures;
The healthy uptrend remains as all four of the big US indexes are above their respective 20, 50, and 200-day moving averages and all are at new highs. In an impressive show of resilience, the S&P has been up 10 out of 11 months on a price only basis. It doesn't get much stronger than this from a trending perspective. If we narrow down to the 10 major sectors, 8 out of 10 reside above their 20, 50, and 200-day moving averages. We also track 9 foreign indexes and all are above their 200-day while the majority are above the 20 and 50-day moving averages. Equity markets across the globe are trending higher.
Breadth in the form of participation is also very healthy. The Russell 2000 has made the biggest jump in the last month as now almost 80% of issues are trading above their 50-day moving averages. The second chart below shows new lows across all markets have dried up while new 52-week highs are starting to accelerate. The advance-decline line is also making new highs confirming the strong breadth of this market. One area that concerns us on a shorter-term basis is the market entering overbought territory. The RSI (last chart bottom panel) is reaching levels that have previously caused some stalling action in the S&P during the run up since summer 2016.
Leadership has seen a rotation in the last few weeks as small caps and value have broken their underperformance as new money has positioned in these areas. The chart below compares growth vs value and the up-trend from the beginning of the year is now broken. This is something we'll be watching closely in the 4th quarter.
While the AAII Index remains in neutral territory the CNN fear and greed index's is flashing warning signals as it now stands firmly in overbought levels at extreme greed. This is way up from neutral one month ago.
Lastly we look at volatility. We now know that October is historically the most volatile month. However, according to our September stats blog we found that September was the second most volatile month in the last 20 years. If you follow stats blindly without taking into context the whole picture that statistic didn't help out too much. In fact, last month was the least volatile September ever recorded.
In summary, as we head into the fourth quarter we firmly believe in following the path of least resistance as the strength and momentum in this market could carry us to the end of the year. The prospect of tax reform getting done has continued to keep a bid in the market. Nonetheless, with elevated levels of sentiment and overbought conditions coupled with the historic volatility of October, we will keep some opportunistic cash sidelined as we enter earnings season. Outside of tech, we are seeing opportunities developing within the current rotation into banks, small caps, and the energy complex.
- Last 20 years: October ranks second in monthly performance with an average gain of 1.86%
- Last 20 years: The average daily trend starts slow and finishes strong
- Last 20 years: October is the most volatile month
- Since 1950: October ranks 7th in monthly performance with an average gain of 0.89%
- Since 1950: October still is the most volatile month yet is higher almost 60% of the time
- Since 1950: If the S&P is up greater than 10% for the year, September was positive, and September hit a new high, the average return for the October-December period is 6.39% (9 prior instances)
We have a lot of data to sort through to shape a thesis heading into the fourth quarter. Clearly there is a bias to the upside as Q4 is historically the strongest quarter by far with an average gain of roughly 4% and higher 79.1% of the time. Also since 1950, the October to December 3-month rolling average is the second best streak only behind the very favorable Nov-Jan period. A nice stat courtesy of Steve Deppe via Wayne Whaley states:
"The S&P has been positive in each of the last six months. Since 1950, there have been 19 previous occasions of a down month and then six consecutive positive months and in all 19 of those setups, the S&P was higher either six of twelve months later, suggesting per this one study, that the odds of a Bear Market in the next 12 months is small."
To throw a wet blanket on all the good data, if we look at how the average October fares after a solid start to the year we get some conflicting signals. We wanted to see how October returns looked when the S&P was up greater than 10% year-to-date and September was positive which are the exact conditions heading into this October. The average monthly return for October is a loss of -0.78%. If we add that September made a new all-time high then October returns 0.33% which is well below the average October from the stats above. However, it finishes strong with a gain of another 6.39% for the rest of the year.
So how do we use this data to position our portfolios? The quantitative data from a seasonality point of view is just one in many data points that goes into our overall thinking but it certainly helps to frame an outlook. Let's take a look at some other measures;
The healthy uptrend remains as all four of the big US indexes are above their respective 20, 50, and 200-day moving averages and all are at new highs. In an impressive show of resilience, the S&P has been up 10 out of 11 months on a price only basis. It doesn't get much stronger than this from a trending perspective. If we narrow down to the 10 major sectors, 8 out of 10 reside above their 20, 50, and 200-day moving averages. We also track 9 foreign indexes and all are above their 200-day while the majority are above the 20 and 50-day moving averages. Equity markets across the globe are trending higher.
Breadth in the form of participation is also very healthy. The Russell 2000 has made the biggest jump in the last month as now almost 80% of issues are trading above their 50-day moving averages. The second chart below shows new lows across all markets have dried up while new 52-week highs are starting to accelerate. The advance-decline line is also making new highs confirming the strong breadth of this market. One area that concerns us on a shorter-term basis is the market entering overbought territory. The RSI (last chart bottom panel) is reaching levels that have previously caused some stalling action in the S&P during the run up since summer 2016.
Leadership has seen a rotation in the last few weeks as small caps and value have broken their underperformance as new money has positioned in these areas. The chart below compares growth vs value and the up-trend from the beginning of the year is now broken. This is something we'll be watching closely in the 4th quarter.
While the AAII Index remains in neutral territory the CNN fear and greed index's is flashing warning signals as it now stands firmly in overbought levels at extreme greed. This is way up from neutral one month ago.
Lastly we look at volatility. We now know that October is historically the most volatile month. However, according to our September stats blog we found that September was the second most volatile month in the last 20 years. If you follow stats blindly without taking into context the whole picture that statistic didn't help out too much. In fact, last month was the least volatile September ever recorded.
In summary, as we head into the fourth quarter we firmly believe in following the path of least resistance as the strength and momentum in this market could carry us to the end of the year. The prospect of tax reform getting done has continued to keep a bid in the market. Nonetheless, with elevated levels of sentiment and overbought conditions coupled with the historic volatility of October, we will keep some opportunistic cash sidelined as we enter earnings season. Outside of tech, we are seeing opportunities developing within the current rotation into banks, small caps, and the energy complex.
Wednesday, September 20, 2017
September Fund Manager Survey
The monthly fund manager survey (FMS) from BAML is out and always
offers an interesting view on the global investing landscape. This
month's survey provides some new data points but doesn't deviate much from that last few months. Fund managers
continue to worry about the same set of issues while their positioning
continues to be overweight the same areas. Cash levels remain too
elevated to set conditions for a market top and US equity underweight is at a 10-year high. Below are the key takeaways straight from the August survey.
In summary, fund managers have been selling US equities into strength while increasing their hedges. After a healthy run in equity markets managers are positioning their exposure in cheaper global markets yet continue to favor growth sectors over defensive ones. With the historically weak August and September about to wrap up we are entering the seasonally strong 4th quarter. In the short term we have internal market indicators flashing overbought conditions as US equities have hit new highs. As we discussed in our last blog september stats to consider, we showed how the back half of September is usually weaker. We will be watching how the markets react to the FOMC announcement today along with any fresh data out of the Fed. In turn, tactically we have used the strength to lighten up some positions but we maintain that any weakness should be bought as we continue to believe this market will finish the year strong. We'll leave you with one stat that is extremely impressive from Ryan Detrick.
"Since '28, S&P 500 higher each month May - Sept ... 4Q has never been lower. Up 6 for 6 with an avg return of 9.6%. Could happen this year."
- 3 talking points: 1. FMS says markets can remain in "Icarus" upside mode for risk assets, 2. "mean reversion" has become contrarian as investorscut expectation of higher bond yields; 3. US equity UW at 10-year high, EM OW at 7-year high as US$ bulls vanish
- On Icarus: Sept FMS shows cash levels high (down from 4.9% to 4.8% but >4.5% ave past decade), largest jump in "taking out protection" in 14 months, lowest OW in equities since Dec'16 & smallest UW in bonds since Nov'16…no irrational exuberance yet
- On mean reversion: rotation back to QE themes of scarce "growth" (e.g. tech - Exhibit 1) & "yield" (e.g. EM), away from "value" (Japan, banks) asinvestors shun mean reversion, slash expectations for "much higher" bond yields (+26% last Nov to 5%); energy ("value") UW largest since Mar'16, utilities ("yield") UW smallest since Aug'16
- On macro: FMS growth optimism continues to sag (+62% in Jan to +25% today) but profit hopes rose a tad this month (+34%)…greater conviction in EPS than GDP; notable divergence in FMS perceptions of fiscal policy ("easy") vs. flatter yield curve (see Exhibit 10) shows US tax reform most obvious catalyst for steeper US curve
- Most crowded trades: 1. long Bitcoin (up $1000 to almost $5000 early Sept), 2. long Nasdaq (up 20% YTD), 3. short US$ (-11% YTD); note longUS$ was most crowded trade as recently as Mar'17 - Exhibit 2)
- On risk: biggest tail risk is North Korea by some margin (tallies with Sept drop in Japan equity exposure), followed by Fed/ECB policy mistake; recession in next 6 months deemed biggest potential surprise, an equity bubble least surprising
- On regions: biggest UW in US stocks since Nov'07, biggest OW in EM stocks since Dec '10; investors have not been this UW the US relative to EM/Eurozone since 2007; weak US$ big factor (US$ now most "undervalued" since Dec'14)
- Contrarians would be: long US$, long US energy, short EM tech, long Japan banks, short Eurozone discretionary/banks
In summary, fund managers have been selling US equities into strength while increasing their hedges. After a healthy run in equity markets managers are positioning their exposure in cheaper global markets yet continue to favor growth sectors over defensive ones. With the historically weak August and September about to wrap up we are entering the seasonally strong 4th quarter. In the short term we have internal market indicators flashing overbought conditions as US equities have hit new highs. As we discussed in our last blog september stats to consider, we showed how the back half of September is usually weaker. We will be watching how the markets react to the FOMC announcement today along with any fresh data out of the Fed. In turn, tactically we have used the strength to lighten up some positions but we maintain that any weakness should be bought as we continue to believe this market will finish the year strong. We'll leave you with one stat that is extremely impressive from Ryan Detrick.
"Since '28, S&P 500 higher each month May - Sept ... 4Q has never been lower. Up 6 for 6 with an avg return of 9.6%. Could happen this year."
Wednesday, September 6, 2017
Some September Stats To Consider
Looking at September Data:
Jeff Hirsch of Trader's Almanac has some interesting commentary about month-end:
"Although the month has opened strong 13 of the last 22 years, once tans begin to fade and the new school year begins, fund managers tend to clean house as the end of the third quarter approaches, causing some nasty selloffs near month-end over the years. Recent substantial declines occurred following the terrorist attacks in 2001 (Dow: -11.1%) and the collapse of Lehman Brothers in 2008 (Dow: -6.0%). Solid September gains in 2010; DJIA’s 7.7%, S&P 500’s 8.8% were the best since 1939, but the month suffered nearly the same magnitude declines in 2011, confirming that September can be a volatile month."
If we turn our attention to the technicals and sentiment we can start to paint a clearer picture. While we remain bullish overall we have continued to be tactically cautious in the back half of summer and into September. With some cash on the sidelines and maintaining our core positions, our patience has been rewarded as the S&P has stalled since mid-July while experiencing the largest intra-year drawdown of 2.9% during August.
One thing we are monitoring is the negative divergence in breadth as the S&P consolidates. The leadership has narrowed and for the market to sustain new highs it will need to be accompanied by a fresh bout of momentum. In what has been a most unloved bull market, the S&P has now had the second longest streak without a 5% pullback since the 90's. It has been 209 days since the last 5% fall and has blown past the streak set during 2014's strong uptrend. With 2017's biggest pullback being just 2.9% so far it seems the S&P will experience a larger drop considering the average intra-year decline is 14%.
- Last 20 years: September ranks second to last in monthly performance with an average loss of 0.61%
- Last 20 years: The average daily trend peaks mid-month and finishes weaker
- Last 20 years: September is the second most volatile month only behind October
- Since 1950: September ranks last in monthly performance with an average loss of 0.51%
- Since 1950: September is the fourth most volatile month and is only higher 44.78% of the time which is the worst probability of any month
- Since 1950: If the S&P is up for the year and August is positive, September has an average loss of 0.17%
With the above data considered, lets look to see what September may have in store. We know that September's typically tend to bring about weakness in stocks with higher volatility. In fact an interesting stat on volatility from the always reliable Ryan Detrick says that:
"The worst September ever for the S&P 500 resulted in a 30% drop in
1931. In fact, no other month has had more 10% drops than September at
seven. Interestingly, January is the only month that has never been down
10% or more."
September 2017 has plenty of story lines that could lead to an unpredictable month and potential for a pullback. As always the geopolitical climate remains hostile and has been the driver of higher volatility the last several weeks. Since the beginning of the year the VIX index has averaged around 11.50. However since the start of August the VIX has twice spiked above the 15 level. Are we due for higher sustained volatility in the coming months? We don't know the answer to that but September and October remain the two most volatile months in the last 20 years. Couple that with a Fed meeting, Harvey cleanup, Hurricane Irma heading towards Florida, the debt limit showdown and a host of other headlines, and the end of September could certainly be interesting. Now we don't expect much out of the Fed meeting with only a 1% chance of an interest rate hike but with the partisan nature of government these days the debt ceiling debate will keep us on our toes.
Jeff Hirsch of Trader's Almanac has some interesting commentary about month-end:
"Although the month has opened strong 13 of the last 22 years, once tans begin to fade and the new school year begins, fund managers tend to clean house as the end of the third quarter approaches, causing some nasty selloffs near month-end over the years. Recent substantial declines occurred following the terrorist attacks in 2001 (Dow: -11.1%) and the collapse of Lehman Brothers in 2008 (Dow: -6.0%). Solid September gains in 2010; DJIA’s 7.7%, S&P 500’s 8.8% were the best since 1939, but the month suffered nearly the same magnitude declines in 2011, confirming that September can be a volatile month."
If we turn our attention to the technicals and sentiment we can start to paint a clearer picture. While we remain bullish overall we have continued to be tactically cautious in the back half of summer and into September. With some cash on the sidelines and maintaining our core positions, our patience has been rewarded as the S&P has stalled since mid-July while experiencing the largest intra-year drawdown of 2.9% during August.
One thing we are monitoring is the negative divergence in breadth as the S&P consolidates. The leadership has narrowed and for the market to sustain new highs it will need to be accompanied by a fresh bout of momentum. In what has been a most unloved bull market, the S&P has now had the second longest streak without a 5% pullback since the 90's. It has been 209 days since the last 5% fall and has blown past the streak set during 2014's strong uptrend. With 2017's biggest pullback being just 2.9% so far it seems the S&P will experience a larger drop considering the average intra-year decline is 14%.
However, there remain many more bullish signals relative to bearish and that's why we remain optimistic overall. The majority of major sectors and the big domestic stock indexes are firmly entrenched in longer term up trends and trade above their 50 and 200-day moving averages. The S&P just finished its 5th straight positive month on a price return basis. This has an upside statistical edge going out 1 to 6 months as the table below proves.
And if we check in on the CNN fear and greed index it is showing that investor emotion currently sits in the fear range. Meanwhile the latest NAAIM Exposure index reading is 77.04 down from the last quarter's average of 85.08.
September has been, historically, a bad month with lots of volatility. However, we remain believers that this is a secular bull and we'll be looking to put some of our cash to work as we near the end of this seasonally weak 3-month stretch and enter the usually strong 4th quarter.
Thursday, August 17, 2017
August Fund Manager Survey
The monthly fund manager survey (FMS) from BAML is out and always
offers an interesting view on the global investing landscape. This
month's survey doesn't deviate much from prior recent months. Fund managers
continue to worry about the same set of issues while their positioning
continues to be overweight the same areas. Cash levels remain too
elevated to set conditions for a market top yet growth expectations
continue to trend lower. Below are the key takeaways straight from the August survey.
The S&P has currently pulled back 2.1% from its recent highs. One would think the strength in the trend this year would have sentiment peaking and hitting extremes. Yet after every little 1-2% down move we get the opposite in which the fear indexes spike and sentiment flips bearish. This leads us to believe that most participants still don't fully believe in this bull market and are ready to sell fast at the first sight of weakness. Fund managers continued high level of cash confirms this and a look at the CNN fear and greed index shows current sentiment is fearful. The recent spike in put/call ratios and vix term structure further displays the lack of conviction in the current market.
A few things we're watching to keep us honest is the weakness in small caps along with the deteriorating breadth. New lows in the S&P 500 (middle panel) have hit the highest levels since June 2016. This is higher than the pre-election weakness we saw last November. The % of stocks above their 50-day moving average (bottom panel) continues to lag. This isn't as concerning as this measure has trended lower for over a year now but it is something we keep an eye on. We would prefer to see new highs in the markets accompanied by a fresh breakout in breadth. In the second chart below we see that 3 out of 4 of the big index's remains in a solid uptrend and above their corresponding moving averages. The one weakness is in small caps as the Russell 2000 has pulled back 5.9% from the July highs, and given up its 2017 gains, while testing longer-term moving averages.
As we discussed in our last post seasonality isn't on the side of bulls the next few months. Couple that with the current length without even a 3-5% pullback and the worsening breadth keeps us with some cash on the sidelines while maintaining core positions from a tactical standpoint. However, what keeps us bullish overall is how quickly the market prices in fear on every little dip as there remains plenty of angst and skepticism. Sentiment remains bearish and is a nice contrarian indicator as this remains one of the most unloved bull markets. With allocations to US equities the most underweight since January of 2008 and tech allocations at a 3-year low, we would favor to put cash to work after any pullback takes hold.
- Bottom line: FMS cash levels high, fail to trigger risk “sell” signal from BofAML’s Bull & Bear indicator; record highs in investors forecasting “Goldilocks” and saying stocks“overvalued”; negative inflection point in FMS profit expectations our key takeaway.
- Aug cash unchanged at stubbornly high 4.9%; asset allocation to cash rises to 9-month
high; but cash & overvaluation fears aside, FMS positioning remains broadly pro-risk,
pro-cyclical (i.e., long Eurozone, EM, banks, equities, short US/UK, energy, bonds).
- Ominous inflection point in profit expectations indicator (was 58% in Jan, now 33%); FMS profit outlook correlates with PMIs, equities vs bonds, HY vs IG bonds, cyclical vs
defensive sectors (Exhibit 1); further deterioration likely to cause risk-off trades.
- Note recession (53%) would be biggest surprise for FMS investors in next 6 months,
then “inflation” (25%); least surprising would be “equity bubble” (34%); biggest “tail risk”
deemed to be Fed/ECB policy mistake, then bond crash & North Korea.
- Anglo-Saxon political angst reflected in lowest allocation to US stocks since Jan’08, to
UK stocks since Nov’08; in contrast EM & Eurozone remain consensus longs (note China
3-year GDP estimates up to 5.8%, highest since Apr’16).
- Top sector overweight is banks (record high), followed by tech (though contrarians note
tech allocation fell to 3-year low); energy allocation drops to 14-month low; allocation to
staples/telecom/utilities (“defensives”) still low, but starting to pick up.
- Contrarian trades: long utilities vs. banks, long energy vs. industrials, long materials vs.
tech, long UK vs the Eurozone.
The S&P has currently pulled back 2.1% from its recent highs. One would think the strength in the trend this year would have sentiment peaking and hitting extremes. Yet after every little 1-2% down move we get the opposite in which the fear indexes spike and sentiment flips bearish. This leads us to believe that most participants still don't fully believe in this bull market and are ready to sell fast at the first sight of weakness. Fund managers continued high level of cash confirms this and a look at the CNN fear and greed index shows current sentiment is fearful. The recent spike in put/call ratios and vix term structure further displays the lack of conviction in the current market.
A few things we're watching to keep us honest is the weakness in small caps along with the deteriorating breadth. New lows in the S&P 500 (middle panel) have hit the highest levels since June 2016. This is higher than the pre-election weakness we saw last November. The % of stocks above their 50-day moving average (bottom panel) continues to lag. This isn't as concerning as this measure has trended lower for over a year now but it is something we keep an eye on. We would prefer to see new highs in the markets accompanied by a fresh breakout in breadth. In the second chart below we see that 3 out of 4 of the big index's remains in a solid uptrend and above their corresponding moving averages. The one weakness is in small caps as the Russell 2000 has pulled back 5.9% from the July highs, and given up its 2017 gains, while testing longer-term moving averages.
As we discussed in our last post seasonality isn't on the side of bulls the next few months. Couple that with the current length without even a 3-5% pullback and the worsening breadth keeps us with some cash on the sidelines while maintaining core positions from a tactical standpoint. However, what keeps us bullish overall is how quickly the market prices in fear on every little dip as there remains plenty of angst and skepticism. Sentiment remains bearish and is a nice contrarian indicator as this remains one of the most unloved bull markets. With allocations to US equities the most underweight since January of 2008 and tech allocations at a 3-year low, we would favor to put cash to work after any pullback takes hold.
Wednesday, August 9, 2017
Dog Days of Summer
Looking at August Data:
- Last 20 years: August ranks dead last in monthly performance with an average loss of 1.31%
- Last 20 years: The average daily trend starts weak and finishes weaker
- Last 20 years: The August through October 3-month rolling return is typically weak with an average gain of just 0.02%
- Last 20 years: Further, August through September is the worst 2-month stretch on the calendar as both months have averaged losses.
- Since 1950: August is second to last in monthly performance with an average loss of 0.09%
- Since 1950: If the S&P is up greater than 10% through July, August has an average loss of 0.83%
- Since 1950: If the S&P is up greater than 10% through July and July was positive, August has an average loss of 0.24% with an average gain of 5.78% for the rest of the year
This leads us to the question of where does the market go from here? If we knew with certainty, we'd all be a lot wealthier... Without the superpower of clairvoyance, we choose to look at historical data and to help us make educated bets.
As we've mentioned before, we think the market remains firmly in a secular bull market. Yet with all bull markets there are always pullbacks and corrections. Per this Ryan Detrick tweet the current streak of 9 months without a 3% pullback for the S&P is the second longest since 1950. This confirms our own data that we touched on in our last blog post about the length without a 5% correction. Does this mean we are guaranteed to get a correction any time soon? No, but the historical data makes the case that the market is past due and to be on alert for a potential fade.
One of our favorite weekly reads is from Jeff Saut at Raymond James and his latest investment strategy letter had some great wisdom:
The call for this week: The D-J Industrials have made new all-time closing highs for eight straight sessions and have made 34
all-time highs year-to-date. Still we keep hearing, as we have for years, “There is a stock market crash coming soon.”
However, history shows stocks NEVER crash from new all-time highs without giving participants a chance to adjust portfolios.
In 1929 the Dow made a new all-time high on 9/3/1929, but the crash came months later (October 28/29th). In 1987 the Dow
made a new all-time high on 8/24/87, but the crash arrived on October 19, 1987. Moreover, as our friend Tony Dwyer
(Canaccord Genuity) writes:
Think about all the non-recession 10%+ corrections over the past 25 years. Don’t they all start with an overbought
condition, too much optimism, and a sense that a correction is overdue and should be bought? How then is one to
determine if the correction would likely be temporary or something more significant? History serves as a great guide –
even in the current cycle. Significant corrections, even if temporary, come with the perception of a probable recession.
The two major corrections over the past 7 years (2011 & 2015-16) were associated with a global crisis that could have
put the sluggish U.S. economy into recession. There is no sign of any significant deterioration in the (1) global
synchronized recovery, (2) U.S. economic reacceleration, or (3) credit market environment that should create the fear
of recession. As a result, we expect any correction to provide a better entry point for a move to our 2018 S&P 500
(SPX) target of 2,800 with a focus in the “pro-growth” sectors.
In summary, we are of the view that barring any major geopolitical risks, we want to be buyers into weakness. We have recently raised some cash as we head into the most challenging 2-month stretch of the last 20 years to hopefully exploit such an opportunity. Couple this historically weak period with the length and persistence of the current up-move without even a mild pullback and we believe there may be better opportunities for entry over the next few months.
Wednesday, July 19, 2017
July Monthly Fund Manager Survey
The monthly fund manager survey (FMS) from BAML is out and always contains an interesting view on the global investing landscape. This month's survey doesn't deviate much from last month's. Fund managers continue to worry about the same set of issues while their positioning continues to be overweight the same areas. Cash levels remain too elevated to set conditions for a market top yet growth expectations continue to trend lower. Below are the key takeaways straight from the July survey.
Meanwhile, sentiment remains in check as cash levels are elevated and the biggest reason for holding extra cash is "Bearish views of the markets". This bearish stance coincides with expectations for "faster global growth" falling to 38% in July, down from 62% in January. Fund managers continue to lose faith in profit and earnings expectations as they sink to the lowest percentage since the US election. Additionally, 17% say corporate balance sheets are over-leveraged, the most since April 2009.
Exhibit 2: Evolution of Global FMS "most overweight global sector"


Exhibit 8: How do you think the global real economy will develop over the next 12 months?
With the news that Republicans could not pull together enough support in the Senate to pass a health care overhaul this will only put more pressure on growth expectations. Much of those assumptions had been built on the idea that growth will come with less regulations and lower taxes. This theme could be pushed out further into the future with the failure to pass an Obamacare replacement. Sentiment could take a hit as traders fear tax reform will not take place this year.
The S&P 500 has now tied the second longest streak in history without a 5% pullback having gone 173 days without such a drop. The index first notched this marker in 2006-2007. The only longer streak was the massive 296-day span during the roaring bull market of the 90's from 1995-1996.
In a previous blog post we commented:
"Below we looked at all instances since 1990 where the NDX closed down more than 2% after having just made a new 52-week high on the prior trading day. From the data, the very short-term (5 days) is neutral but going out further there is a bias to the upside. It shouldn't surprise anyone if we make new highs sooner than expected. The one caveat in the data below is many of the data points happened during the super bull of the late 90's. If we included the crash of 87 the results are worse but it was such an outlier we chose to ignore. Regardless we thought it was interesting enough to present."
Since then all markets have made new highs or tested highs. The trends remain favorable to the bulls as all moving averages are pointing strongly higher. We still favor the trend and positioned bullishly but also acknowledge there will/should be pullbacks along the way. With seasonality setting up for a potential increase in volatility along with the excessive length without a 5% pullback, we are comfortable being patient with some cash on the sidelines looking for better entries as we navigate earnings season.
- Bottom line: 1. cash levels still too high for "big top"; 2. too many see Fed as likely negative catalyst while inflection lower in growth/EPS estimates being ignored; 3. energy>banks, US>Eurozone, commodities>cash (Exhibit 1) = best contrarian trades
- July FMS cash levels dip from 5.0% to 4.9%; but cash remains well-above 10-year average of 4.5% & allocators very OW the asset class(Exhibit 1)…cash too high for "big top"
- 3 most crowded trades: long Nasdaq (38%), long US/EU credit (15%), long Eurozone equities (12%)…means ECB most likely central bank to spark global "risk-off"
- 3 biggest tail risks: crash in bond markets (28%), Fed/ECB policy mistake (27%), China credit tightening (15%)…central banks seen as muchbigger risk (the "red herring") than EPS, and yet…
- …clear inflection point lower in FMS growth/EPS expectations; 38% expect stronger growth vs. 62% in Jan; 41% expect stronger profits vs. 58% in Jan
- July rotations: investors bought Japan, healthcare, materials, commodities; investors sold tech (68% say US/global internet stocks "expensive"), UK, discretionary, industrials
- July positions: big longs in banks (knocks off tech as #1 global sector OW), Eurozone, EM; big shorts in UK, energy & US stocks (last time UW in US stocks larger was Jan'08)
Meanwhile, sentiment remains in check as cash levels are elevated and the biggest reason for holding extra cash is "Bearish views of the markets". This bearish stance coincides with expectations for "faster global growth" falling to 38% in July, down from 62% in January. Fund managers continue to lose faith in profit and earnings expectations as they sink to the lowest percentage since the US election. Additionally, 17% say corporate balance sheets are over-leveraged, the most since April 2009.
Exhibit 2: Evolution of Global FMS "most overweight global sector"
Exhibit 3: Evolution of Global FMS "most crowded trade"
|
Exhibit 6: If you are holding consistently higher levels of cash in recent quarters, does this reflect:
|
Exhibit 8: How do you think the global real economy will develop over the next 12 months?
With the news that Republicans could not pull together enough support in the Senate to pass a health care overhaul this will only put more pressure on growth expectations. Much of those assumptions had been built on the idea that growth will come with less regulations and lower taxes. This theme could be pushed out further into the future with the failure to pass an Obamacare replacement. Sentiment could take a hit as traders fear tax reform will not take place this year.
The S&P 500 has now tied the second longest streak in history without a 5% pullback having gone 173 days without such a drop. The index first notched this marker in 2006-2007. The only longer streak was the massive 296-day span during the roaring bull market of the 90's from 1995-1996.
In a previous blog post we commented:
"Below we looked at all instances since 1990 where the NDX closed down more than 2% after having just made a new 52-week high on the prior trading day. From the data, the very short-term (5 days) is neutral but going out further there is a bias to the upside. It shouldn't surprise anyone if we make new highs sooner than expected. The one caveat in the data below is many of the data points happened during the super bull of the late 90's. If we included the crash of 87 the results are worse but it was such an outlier we chose to ignore. Regardless we thought it was interesting enough to present."
Since then all markets have made new highs or tested highs. The trends remain favorable to the bulls as all moving averages are pointing strongly higher. We still favor the trend and positioned bullishly but also acknowledge there will/should be pullbacks along the way. With seasonality setting up for a potential increase in volatility along with the excessive length without a 5% pullback, we are comfortable being patient with some cash on the sidelines looking for better entries as we navigate earnings season.
Subscribe to:
Posts (Atom)