Wednesday, January 31, 2018

A blistering start to the year. Now what?

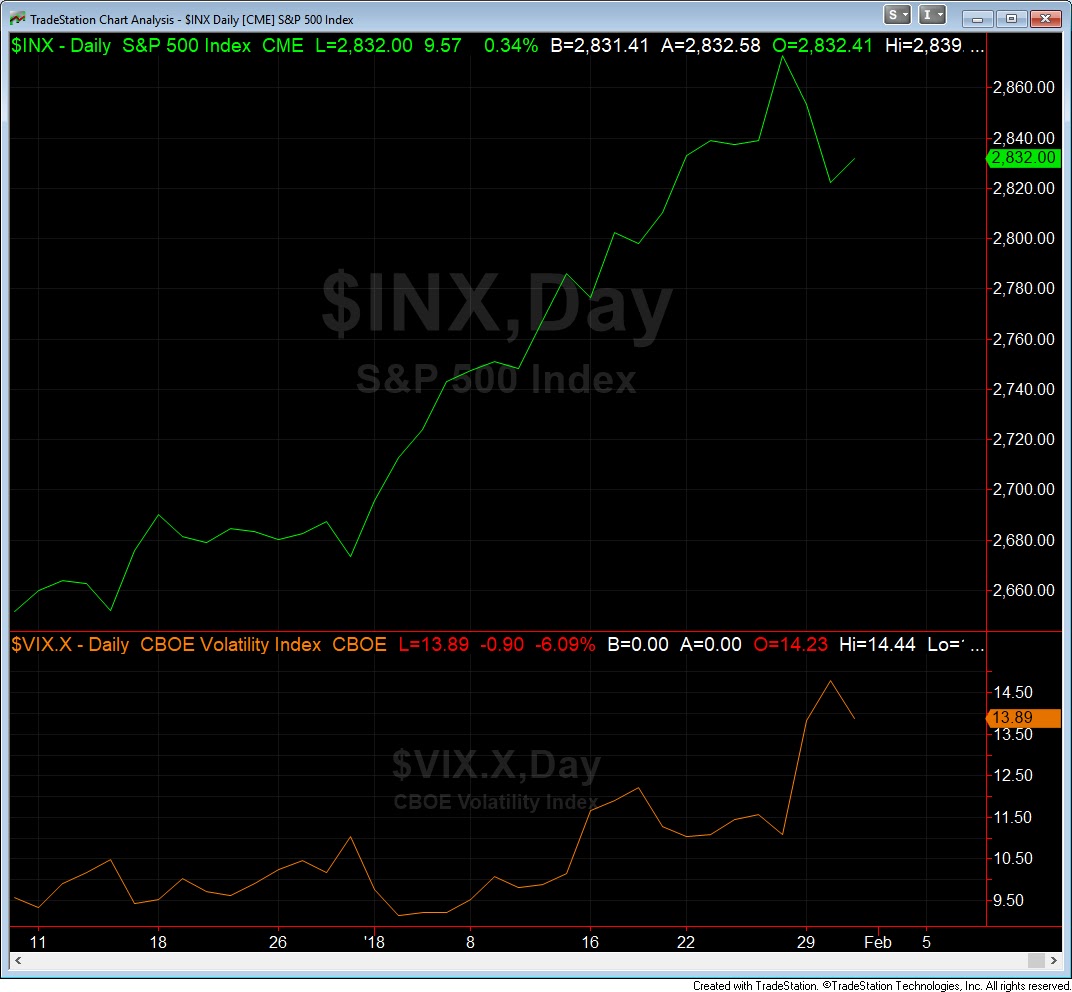
Global and domestic equities have started off 2018 on a blistering pace to the upside continuing the strong uptrend from 2017.   The idea that the new year would usher in tax selling after big gains last year couldn't be more opposite.  Instead, it seems as if money has poured into equity funds in a fear of missing out trade.  This market is being labeled a melt up market and frothy.  While short term indicators show that US equities are overbought we continue to think that the secular bull market remains the dominant trend and there is plenty more to come.  However, that doesn't mean we should not expect heightened volatility and periods of shakeouts and draw-downs.  We assume they will occur and the move in volatility this month is a testament to that theory.  In fact, this January hit another new record as it was the first time that the S&P 500 and the VIX both hit a new 10 day high at the same time. Below looks at how the VIX and S&P have become more correlated and trended higher throughout January.  

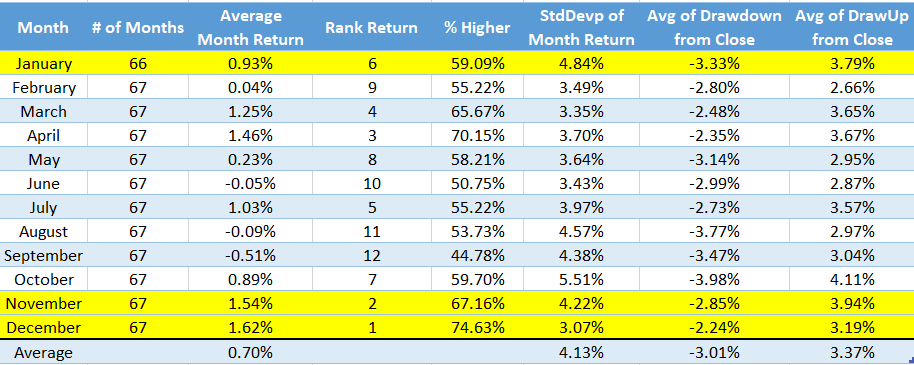
Lets take a look at the February Data:
  • Last 20 years: February ranks eighth in monthly performance with an average loss of 0.02%
  • Last 20 years: The average daily trend is choppy and trend-less
  • Last 20 years: February is the forth most volatile month 
  • Since 1950: February ranks ninth in monthly performance with an average gain of 0.10%
  • Since 1950:  February is the 9th most volatile month and is higher 56% of the time
  • Since 1950:  January is tied with July with the most 5% or greater monthly gains


We want to see what the S&P did for February, full year, and the rest of the year after gaining more than 5% in January.  The sample size is small with only 12 prior instances going back to 1950 but still paints a rosy picture for 2018.  We took it a step further in the second study looking for prior instances of a 5% or greater January and the prior month hit a new high  Even smaller sample size but still remains bullish.  


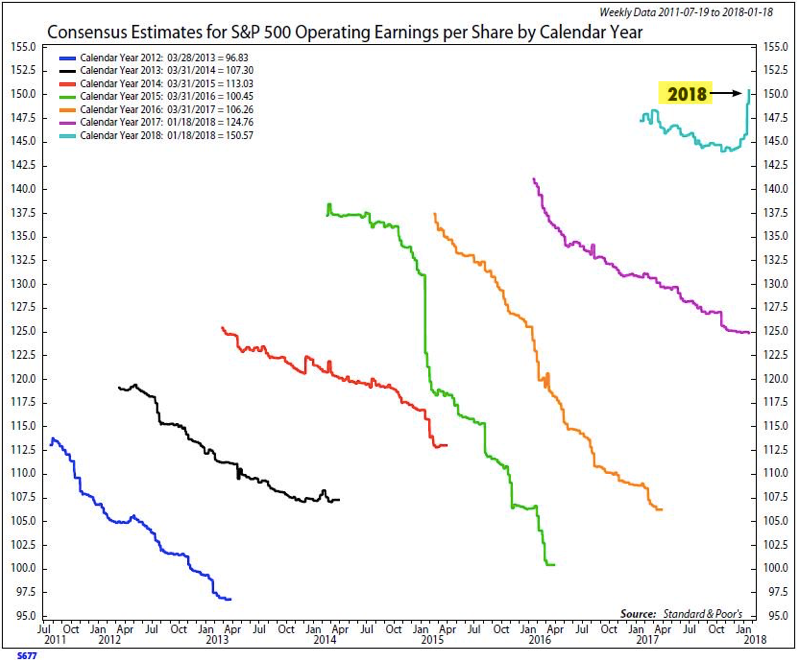
One of the main reasons driving this bull market is that we are going from a QE market to an earnings driven market.  This is the first time in a while that earnings revisions are actually be raised rather then revised downward throughout the year (from NDR). 

There is a legitimate concern about the rise in rates and rightfully so.  However, we looked at the data when the S&P was up more than 5% and the TNX (10 yr yields) are up greater than 10% just like this January and we find that the returns in the S&P remain favorable to the bulls going out 1,2,3, and 6 months.  Are the rise in rates signaling a better economy?  We think so, and also believe that rates will have to be much higher before they become a big problem.  There was only one prior instance of January gaining more than 5% and TNX gaining more than 10%.  That was in January 2013. 


The 3 major averages all broke their steep up trend-line from the January lows on Tuesday.  This simple 1% down day, which was the first one in 112 days, caused traders to panic and it seems as if sentiment went from overly optimistic to extremely bearish in one day.   The CNN fear and greed index sits at 61 as it pulls back from extreme greed at the same time the put call ratio spiked along with the VIX.  Yet, the S&P broke the record for number of days without a 5% correction this month.  The US equity markets have started the year off on a hot start.  We don't expect the same bullishness every month this year but the stats favor another strong year.  Even though we remain bullish longer term we expect bouts of volatility to increase throughout the year and having a tactical view will prove to be prudent. 

Wednesday, January 17, 2018

Plenty of bulls

The dominant trend of global equities remains higher and has accelerated to the upside to begin the year.   A handful of indicators are flashing frothy levels in the short term but the first few weeks of the New Year also ushered in an increase in breadth as momentum accompanied new price highs.  Today's reversal after the large gap up could signal that we are due for some weakness in the near future.  The data and sentiment suggest that we are overdue for some give back after the torrid pace set in the first few trading weeks of the year.  In the first two charts below we look at how breadth has expanded in the form of new 52-week highs and the % of stocks trading above their 50 & 200 day moving averages.  Both indicators are expanding as the indexes make new highs.  The last chart shows how the S&P remains overbought based on the 14 period RSI.  If we look at examples from last year's bull run, when the RSI reached extremes, the market tended to consolidate once it reach these levels.  Steve Deppe sums up what the data looks like after yesterday's one-day outside reversal from 52-week highs while volatility is also rallying.  


Sentiment and position presented in the monthly BAML survey gives us a glimpse into fund managers perspective on the global investing landscape.  The viewpoints documented in the monthly survey gives us the ability to look at a potential contrarian outlook to shape trades against the herd.  January's data has plenty of trends to observe and below we address the more notable takeaways. 

January rotation shows a buying of cyclical plays and selling of defensive plays.

Net hedge fund equity market exposure jumps to 49% which is the highest since 2006.

A majority of investors now expect a peak in equity markets in 2019 or beyond, pushing back the timing by two quarters from December, when the majority expected a top in Q2 2018.


Investors overweight allocation to equities relative to overweight bonds highest since August 2014.


Allocation to equities jumped to 2-year highs of net 55% overweight.  Current allocation is high at 1.1 stdev above its long-term average.


Allocation to US equities slips to net 17% underweight from net 15% underweight last month while allocation to Eurozone equities holds a net 45% overweight remaining elevated vs history. 


In conclusion, the trend remains up as all US equity indices hit a new high yesterday.  However, with the reversal off new highs on healthy volume after the current thrust higher over the last week, we expect volatility to pick up.  Coupled with the excessive sentiment and the aggressive positioning in equities from managers we are watchful for any pending weakness.   From a contrarian trade it seems as the herd is positioned for continued strength with little worry of the market peaking.  Considering how fund managers are deploying their capital the biggest shock would be a market top in the first quarter and a real correction during 2018.  We still believe the market is healthy and short term pullbacks should be expected.  We view these potential pullbacks as opportunities and still favor US equities as they remain underweight versus their European counterparts. 

Friday, December 22, 2017

2018 Market Prediction

With the New Year rapidly approaching we are starting to see a flurry of market predictions for the 2018.  After extremely healthy returns across the global landscape in 2017 it is no coincidence that most prognosticators are bullish heading into next year.  As much fun as making predictions are, we also know that most are a waste of time and useless.  You only have to look at recent history of how awful these year end calls end up.  Nevertheless, most investors like seeing and hearing positive projections.  We prefer to gauge the current market temperature by analyzing various data points which help shape our bias in the short, intermediate, and longer term.  We study indicators including fundamentals, sentiment, volatility, and technicals.  One of the better blogs out there is from Urban Carmel at the Fat Pitch.  His recent blog takes a peek at 2018 and touches on a few of the data points we also watch.  I recommend reading the whole piece but I wanted to highlight one that stood out to us.  Most pundits will use past data to shape their future outlook.   However as we see from Urban's blog, prior years returns have no bearing on what stocks will return the following year.

"Data over the past 120 years shows that whatever happens in one year has very little impact on returns or probabilities the following year. If stocks gain over 20% this year, their return next year is not much different than if the market had fallen this year (right column). Moreover, the odds of stocks rising next year is the same regardless (second chart; both from Mark Hulbert)."


If we turn our attention to the monthly BAML global fund manager survey we can get a better idea of current sentiment and bias in the world markets.  Below is a recap of the December survey.

December FMS takeaways
  • Icarus loves Cash: Dec FMS shows investors raising cash to 4.7% from 4.4% despite surging credit & stock markets, paving way we think for more risk asset upside in Q1.  BofAML Bull & Bear indicator @ 6.2 is not excessively bullish, consistent with further Icarus trade upside. When asked when equity markets will peak, 25% of investors sayQ1’2018, 30% say Q2, 28% say H2.
  • Golditrumps: consensus still smitten by Goldilocks...54% expect “high growth, low inflation” in 2018. Almost 2/3 investors believe US tax reform will induce higher stocks& rates, but fiscal stimulus has coincided with lower, not higher profit expectations, and that will need to change given EPS leads relative performance of cyclicals by 3 month(Exhibit 10).
  • Pro-cyclical Consensus: Investors are long macro “boom”, short “bust”; long stocks,EU/Japan/EM stocks, financials (2nd largest ever), materials (highest since 2/2012) vs short government bonds, US stocks, healthcare & utilities. Pro-cyclical consensus entrenched by US tax reform across asset classes, bar, intriguingly, leading tech sector where allocations dropped to lowest since June 2014 (Exhibit 4).
  • FMS Crowded Trades: ...#1 long Bitcoin (32%), #2 long FAANG+BAT (29%), #3 short volatility (14%), while expectations for a “flatter yield curve” surged (highest in 18months), all trades vulnerable to higher inflation & aggressive ECB/BoJ Quantitative Tightening in 2018.
  • Contrarian Recession Trades: ...a recessionary bust even more contrarian than inflationary boom, lower rates more contrarian than higher rates, making short equities long bonds, short banks-long utilities, short EAFE-long US stocks the most contrarian trades of all heading into the new year.
We believe the strong returns of 2017 was due to multiple factors, however the growth of global economies and therefore earnings was the main driver of success.  This reveals itself in the survey as 54% of managers expect high growth and low inflation in 2018.  This is one of the main arguments for a bullish 2018.  A stable and growing economy coupled with US tax reform that could turbo charge earnings is what has us most excited for next year.  Before we get ahead of ourselves we need to recognize that some of this has been priced in the current markets.  As global markets sit at or near new highs it is interesting that the percentage of fund managers saying equities are overvalued is at multi-decade highs.  You would have to go back to the late 90's to find similar readings.  Meanwhile allocation to tech stocks falls to a 3 1/2 year low.  It seems managers are taking some profits after a huge run in tech related stocks.  Yet this could act as a contrarian buy signal for next year for this sector.  FMS cash rose to 4.7% reflecting a neutral stance among investors as cash levels are not near excessive overheated levels.  With cyrto-currencies the hot buzz word this holiday season it is no surprise that the most crowded trade is long Bitcoin.  With US tax reform passing Congress, two thirds of managers expect tax reform to result in higher bond yields and higher stocks while only 3% think it will lead to lower yields and stocks.  Lastly, allocation to US equities rises to net 15% underweight as Eurozone falls to net 45% overweight, but remains elevated versus history at 1.1 stdev above its long-term average.


In conclusion, we remain firmly in the secular bull market camp.  Yet, we also know from historical norms that the average intra-year drawdown is 14% in the S&P.  2017 was clearly an anomaly with regards to volatility as the biggest drawdown was a measly 2.9% and the last 5% drawdown occurred almost two years ago.  We expect a bigger drawdown at some point in 2018 coincided with a rise in volatility.  Regardless, we don't think it will derail the bull market and should be used as a buying opportunity as US equities remain underweight.  One of the biggest reasons we think predictions are so silly is the global markets are so dynamic as information changes rapidly.  At any given moment a new catalyst can reshape our thesis, however as we stand today the investing landscape looks promising into 2018 with the potential for an upside kicker in US markets based on tax reform.

We want to wish everyone a happy and safe holidays and look forward to what 2018 holds!

Friday, December 1, 2017

How will market finish the year?

  • Last 20 years: December ranks fourth in monthly performance with an average gain of 1.47%
  • Last 20 years: The average daily trend starts strong then fades mid month only to finish close to the highs
  • Last 20 years: October is the least volatile month 
  • Since 1950: December ranks 1st in monthly performance with an average gain of 1.62%
  • Since 1950:  December is the least volatile month and is higher almost 75% of the time
  • Since 1950:  If the S&P is up greater than 15% through November, November was positive, and November hit a new high, the average return for December is 1.92% (10 prior instances)


The general market remains firmly in an uptrend and bull phase as the S&P, Dow, NYSE, Russell 2k have all hit new highs in November.  The Nasdaq is slightly below new highs with recent rotation out of big cap tech on Wednesday as managers seem to be positioning their portfolios in financials and small caps with the prospect of tax reform before year end.   While the overall trend remains up and the seasonal data presented above is favorable for the markets to finish the year strong we always look at all the data to shape a thesis.  There are certainly more than a few indicators flashing a cautionary sign as the indexes have become overbought in recent days.  Strong markets tend to stay overbought and this year is not different.  However from a tactical standpoint we always try to survey the whole landscape to make more informed decisions.  The S&P has flashed overbought conditions with respect to RSI, Stochastics, Bollinger Bands, etc.  The CBOE equity put call volume ratio hit a new low for the year as traders remain very complacent.  The CNN fear and greed index is showing levels of green but well off extreme levels earlier this year.  All of these overbought conditions are not a reason to sell but rather raise our level of awareness to a potential consolidation or pullback in the ongoing upward momentum.  A recent post from the always informative fat pitch blog focuses on a data point that shows the unfavorable risk-reward conditions over the next few weeks. 


In summary, as we head into the last month of the year we continue to favor the long side of this market.  As always, there are some warning signs from a tactical standpoint that have heightened our senses.  From a risk management perspective we have continually raised our stops on existing positions while looking for opportunities from sector rotation and pullbacks in current leaders.  At some point the markets will have a real correction of more than the measly 2.9% we have endured so far this year.  That outcome may have to wait until 2018 as investors put off selling winners into the new year on the prospect of tax reform. 
Tuesday, November 14, 2017

November Fund Manager Survey

Over the past few blogs we have looked at why the market could be due for a pullback.  Outside of the Russell 2k the majority of the big indexes have lugged higher with a persistently strong trend.  As we enter the historically strongest 3-month period in the market and with the potential for tax reform on the horizon we remain bullish till year end.  What we found interesting in the monthly data is that if we only looked at the last 20 years the trends change.  This certainly has a lot to do with the 2 major bear markets we have experienced but nonetheless the findings are intriguing.  Especially the weakness in January the last 20 years versus the larger time period.  Considering the strength of the market this year it would make sense to push off selling winners until 2018 especially if tax reform is accomplished.  This could bring in some volatility in the beginning of the new year.  Below we look at the monthly performance of the S&P 500 going back to 1950 and the most recent 20 year period.  Since 1950, the Nov-Jan period is the strongest 3-month period historically.  If we limit it to the last 20 years it ranks as the 5th strongest 3-month period, although November and December are very strong in both time frames.  This should bode well for a strong finish to year end. 


In our role of portfolio management we always want to play devils advocate and poke holes in our thesis so we don't turn a blind eye to potential pitfalls.  The data above certainly paints a bullish picture the next few months.  In our last blog on divergences we highlighted how momentum has peaked creating a negative divergence.   Below we look at the recent weakness in high yield and what that may forecast for the equity markets.  We can see in 2017 when high yield index has broken down this leads to a slow down in equity markets.  Is this time different?  We don't have the answer to that but it is something we continue to monitor. 


If we turn our attention to the monthly fund manager survey (FMS) from BAML, there are a some levels that are flashing a more cautious tone.  Below is a recap of the current month takeaways straight from the November report.
  • It’s frothy FAANG: big market conviction in Goldilocks (+ price action in FAANG/BAT,
    Bitcoin) leading to bull capitulation; FMS risk-taking hits all time high (Exhibit 1), cash
    decisively lower despite record high saying equities overvalued (= irrational
    exuberance)…our conviction in winter post-tax reform risk asset correction hardens
  • Consensilocks: all-time high Goldilocks expectations (56% expect “high growth, low
    inflation”); contrasts with tumbling bear view of secular stagnation as macro backdrop
    (was 88% Feb’16, now 25%); US tax reform expected to sustain or inflate Goldilocks
  • Ever closer to the sun: Nov FMS cash level drops to 4.4% from 4.7% = lowest since
    Oct’13 & no longer a “buy signal”; FMS hedge fund equity exposure at 11-year high;
    BofAML Bull & Bear Indicator up to 7.2 but sell-signal not yet triggered
  • Correction catalysts = inflation & market structure: biggest FMS risk to EPS =
    wage inflation; rising FMS concerns re “market structure” (3rd biggest tail risk);
    strategies most likely to exacerbate correction…vol selling (32%), ETFs (28%), risk parity
    (16%)
  • Notable FMS takeaways: crowded trades are #1 long Nasdaq, #2 short volatility, #3
    long credit; highest global equity OW since Apr’15, highest Japan OW in 2-years, an epic
    FMS UW in UK assets, and big Nov rotation to energy from bank stocks
  • Contrarian stagflation trades: long UK, short Eurozone; long pharma, short banks;
    long utilities, short tech
The first few charts should be grouped under opposite opinions.  There are a record number of managers taking higher than normal risk as hedge funds net equity exposure rises to an 11 year high of 47%.  In the same breadth those same fund managers say that equities remain at excess valuations but are putting cash to work with cash levels falling to 4.4%.  Our own opinions make us think that under-performing fund managers are willing to risk capital over the next few months to try and catch up to their benchmarks regardless of the stretched valuations presented.  From a global economic outlook the data remains favorable.  This is displayed in the fund managers expectations of the global economy in the next 12 months.  Expectations in the "Goldilocks" scenario (above-trend growth and below-trend inflation) rose 8ppt to 56% which is another record high.   


We'll leave you with one more data point we recently read that pique our interests.  Jason Goepfert from Sentiment trader wrote this last night:

The S&P’s split personality.  Last week, there were a lot of buying climaxes (reversals from 52-week highs) in S&P 500 stocks - 32 of them, which was up from 20 the prior week. There were also a lot of selling climaxes (reversals from 52-week lows), 17 of them, which is highly unusual in a week when there were so many buying climaxes. Usually there are many of one or the other, not both. The only time we’ve seen so many of both kinds of reversals, showing a highly split market, was in March 2000.

Once again we have presented alternative view points for both bulls and bears to consume.  We remain firmly in the bullish camp as we continue to operate within our secular bull market assumption.  However with some negative divergences appearing along with some inflated conditions to the upside we have some cash on the sidelines to put to work on any weakness as we look for a strong close to year end. 

We hope everyone has a safe and wonderful Thanksgiving!  We certainly are thankful over at Worch Capital for all blessings we have. 
 

Tuesday, November 7, 2017

New highs but signs of divergences

The market indices continue to chug along as they steadily make daily new highs with the exception of small caps which have lagged recently.   We have not touched on correlations of late but this has proven to be the year of stock picking.  During most of the QE environment from the market bottom in 2009 correlations remained abnormally high as asset classes and sectors followed each other in the same direction in a herd mentality fashion.  However sector correlations have completely diverged throughout 2017 and are hitting the lowest levels by a wide margin.  Below we look at the 30-day average correlations of the major S&P 500 sectors.  We overlaid the trend of the S&P 500 during the same time frame.  It clearly illustrates how 2017 has been a stock pickers year as correlations have collapsed.  We believe this is another endorsement for active management going forward.


Below is a great blog post from Chris Kimble that highlights the divergence in equal and market capitalization indexes.   This shows how a few big cap stocks (think FANG stocks) that have performed well are propping up the indices.  The equal weighted indexes are under-performing the cap weighted indexes by a whopping 25%.  We also see this divergence in our own breadth indicators.  One simple one we follow is the amount of stocks trading above the 20 and 50 day moving averages.  The second chart shows how momentum has peaked prior to price displaying a negative divergence.  This usually is resolved to the upside but we can see typically when momentum fades this tends to lead to a level of consolidation or pullback before breadth picks up and momentum resumes. 


The S&P remains overbought and with momentum fading we could be in for some short term weakness as the market digests the recent gains.  However, as earnings season had been favorable to equities and with the potential for tax reform this should keep a bid in the market.  Coupled with correlations at multi-year lows this sets up nicely for an active manager assuming you are positioned in the right areas, as we think the strong will get stronger and the weak performers will be under tax selling till year end. 


Wednesday, October 18, 2017

Are we due for a pullback?

This is a question we are constantly asked and one we find the hardest to answer.  If we knew every time the market was going to pullback we wouldn't be writing this blog, instead we would be counting our dollars.  What we attempt to do is weigh the evidence presented and trust our research while making educated bets.  We wanted to start with a simple picture of the current landscape and move on from there.

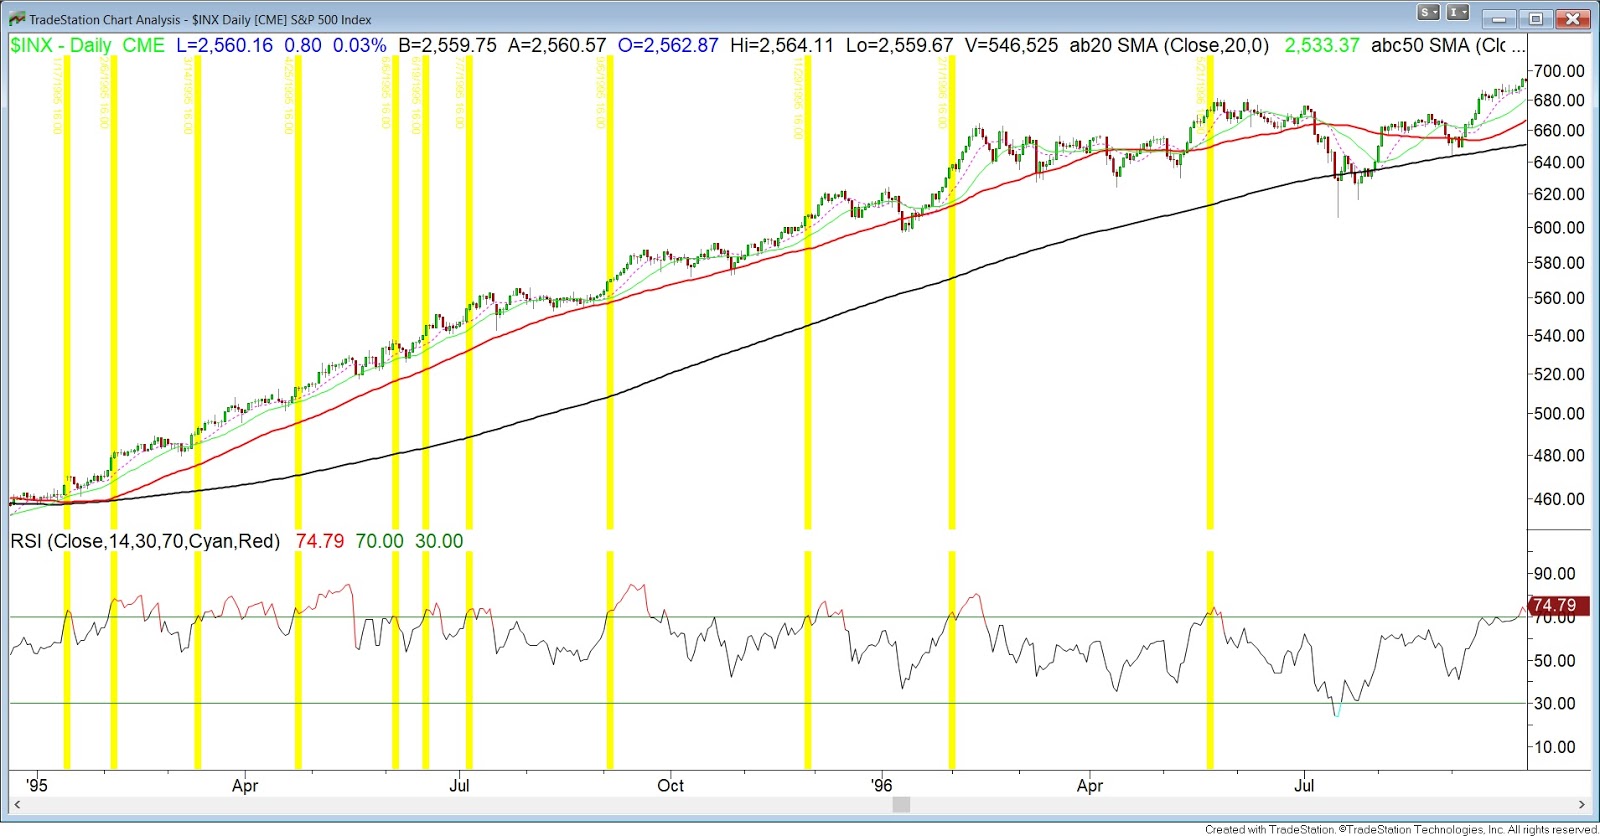
Below is a chart of the S&P with a simple 14 day RSI.  We know from historical data that an overbought RSI doesn't necessarily mean we are due for weakness.   In some instances it is forecasting future strength and in other cases it anticipates potential pitfalls.  The data going back to 1960 shows no statistical edge going out a few weeks or months trying to predict an overbought RSI.  In previous posts we have referred to prior strong trending years for comparison purposes.  We still believe these to be true and why we are highlighting this below.  1995 was one of the strongest trending years in recent past and we can see that the RSI stayed overbought for much of the year while the S&P trended higher.  The 2013-14 market had multiple instances of an overbought RSI all the while the market trended higher for months.  This year is shaping up much in the same fashion as these two years.  What we have noticed is that in most cases when the 14-day RSI became overbought the S&P went on to consolidate or pullback in the near future.  As with any indicator it is not full proof but it is something that we watch and heightened our risk metrics. 


Next we wonder if the S&P has broken out to the upside from its 12 month ascending wedge pattern.  The path of least resistance is higher and if we do get a pullback we'll be watching the top of that channel for support.  What we don't want to see is a hard sell off back into the range causing a failed upside breakout.  This could lead to a longer consolidation. 


Another useful tool is the monthly fund manager survey (FMS) from BAML.  It always offers an interesting view on the global investing landscape and is a good barometer of current market sentiment.  Below are the key takeaways that we focused on. 

One data point that backs up the case for a potential pullback is that global equity overweight suggests risks ahead for stocks.  With global equity net overweight now at +45% this has historically coincided with equity underperformance versus bonds & cash over the next 3 months.  


Fund managers are positioning themselves for higher rates as just 3% of investors think global bonds will be lower in the next 12 months.  82% say bond yields will rise and a record 85% say bonds are overvalued.  The rotation into banks (biggest in 3 years) and Japan while selling utilities, emerging markets, healthcare, and bonds is evidence managers expect higher yields ahead. 


Cash has fallen to 4.7% but still remains high as this is a catalyst for shallow pullbacks.  Managers are waiting for any dip to put cash to work. 


Through all of our research we continue to conclude the general markets remain in a secular bull market.  One of our thesis was the strong backdrop of our economy coupled with growth in earnings is what is propelling equity markets higher.  Below supports our opinion as the expectation for macro "Goldilocks" (above-trend growth, below-trend inflation) is at record highs.  It is the first time since March 2011 this exceeds investor belief in below-trend growth & inflation as the driver of financial markets. 


In summary with the current overbought conditions along with global equity overweight we are mindful for a potential pullback/consolidation at any moment.  Yet with cash levels still high to support dip buyers and a stable and growing economy the bull market is alive and well.  To strengthen the bull case we are entering a seasonably strong period in the market that we discussed in our last blog.  With earnings season upon us, we'll be looking to put cash to work in fresh new ideas but not chasing strength blindly considering the current outlook.