The chart below shows the average behavior for the S&P 500 in October over the last 20 years. We've typically seen the index find its low for the month around the 9th or 10th and then proceed to finish October higher by an average of almost 2%.
As we noted in our last blog, October ranks as the best month for stocks over the last 20 years and kicks off the seasonally positive 4th quarter window as November ranks 3rd in strength and December comes in at 5th. However, while October has been the strongest performing month over this timeframe it also carries the highest standard deviation of any month.
And looking back to 1950, while October's standard deviation rank still shows it as the most volatile month of the year, its average return falls to just 7th best.
So obviously, equity market performance in recent October's has come in quite positively. Couple that with an environment where sentiment remains in check and we could be setting up for more positive performance. For instance, the CNN Fear & Greed index (composed of 7 different inputs) currently sits in neutral after checking in at "fear" levels a month ago.
Meanwhile, we're currently seeing a rotation into small caps as advisors/investors may be positioning for the next leg up in this bull market.
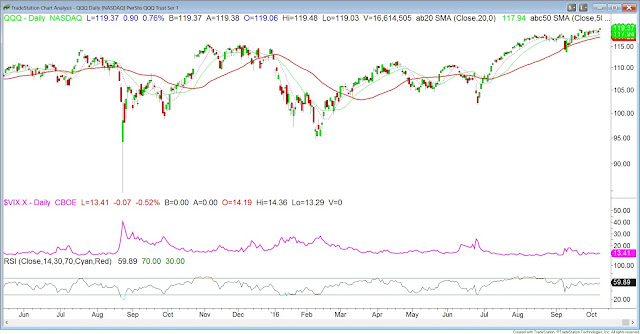
From a relative strength perspective, growth remains the place to be as the NDX 100 continues to hit new highs.
We've got earnings season, the ever dramatic presidential race and the potential of Fed action between now and year-end. According to the stats shown above, a pick-up in volatility at some point in October would not come as a surprise.


