Looking at August data:
- Last 20 years: August ranks dead last in monthly performance with an average loss of 1.02%
- Last 20 years: August has the highest average draw-down from the prior months close while the second lowest draw-up from prior months close
- Last 20 years: The average daily trend starts weak and finishes at the lows
- Last 20 years: August is the third most volatile month
- Since 1950: August ranks second to last in monthly performance with an average loss of 0.09%
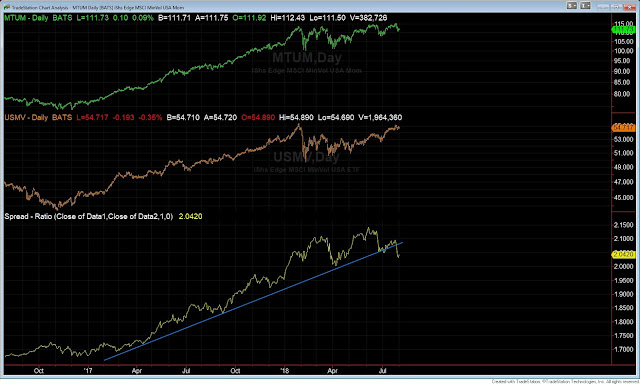
The momentum trade started to breakdown the last few days of July. Lets look at some ratio charts to possibly confirm rotation into more defensive names. The first two charts compare momentum to low volatility. Both are breaking down below their lower trend line support. The last chart is a ratio of consumer discretionary to staples. What all three have in common is that lower volatile and more defensive names are outperforming recently. Does this confirm the trend has changed? The evidence is not resounding enough just yet to substantiate this rotation. Yet, this is something we'll closely monitor as we enter August.
The bull market in equities continues with most indices at new monthly closing highs or very close. We touched on breadth in our last post and with the recent breakdown in momentum stocks we could be in for some short term pain. Couple that with the weak seasonality of August and September could set the stage for better entry levels lower before the bull resumes higher.


