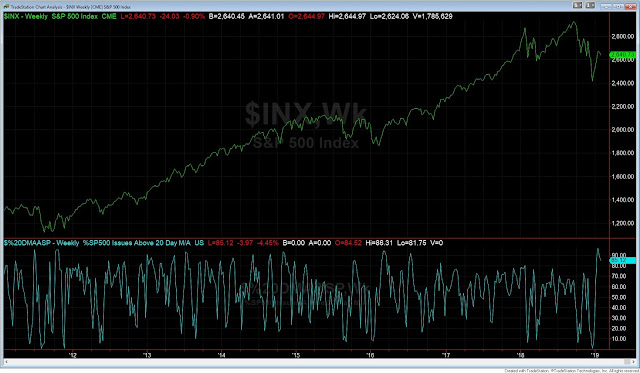
What a difference a month makes. The markets have staged an impressive rally off the lows in the last month. In the face of a government shut down the S&P 500 has rallied 14% off the December lows. The S&P has now rallied right back into the congestion zone were the market broke down and plunged in December. We have traded back above the 50 day moving average but remain below the descending trend-line from the October top. We also have rallied right into the 50% retracement level from the Oct-Dec selloff.
Below are some indicators that have gone from historical oversold readings to now overbought in just one month.
Breadth:
- The % of stocks trading above their 20 day moving average went from below 2 to above 90.
- In late December we had over 1500 new monthly lows. On January 18th the market had over 1000 new monthly highs.
- The 10 day NYSE ratio of advances versus declines went from a low of .46 to over 2 registering the highest reading since the financial crisis.
- The amount of stocks up 20% in a month went from just 16 to almost 800.
- The % of stocks above their 40 day moving average went from the lowest reading since 2008/09 (3.55%) to 76%.
- The S&P 500 made 239 new 52-week lows on Dec 24th, which was highest reading since 2008. On Jan 28th the S&P had 1 new low.
- The McClellan Oscillator went from -300 to +300.
Sentiment:
- The CNN fear and greed index went from an extreme fear reading of 12 to a greed reading of 58.
- The Put/Call ratio went from the highest reading on record of 1.82 to well below 1.
- The VIX index has gone from over 35 to below 20.

Why is the evidence split, with falls greater than 15% having low retests but breadth thrusts not? Since 1980, the large falls without a low retest were all followed by a breadth thrust; that includes both 1982 and 2009 as well as the second low in February 2016. In comparison, when SPX fell back to test its prior low, a breadth thrust was missing every time. In short, the breadth thrust seems to have made the key difference."
One of the reasons for the plunge in markets was the hawkishness of the Fed during the fall. Since the December melt down, the Fed has changed their tone to a more dovish stance which is acting as a headwind for equity prices. In fact, the market is currently pricing in zero hikes for the year. The trade war continues to weigh on the market and our best guess is this will end with another extension as they continue to horse trade with a workable deal both sides can agree to. The risk to the downside is a halt in the trade talks and we are stuck with more tariffs and an escalation in rhetoric. Earnings season gets into full swing this week and our attention will be on the reaction to the news. If XLNX was any barometer of strength, high flying growth names should be kept on your radar.
Will the buying pressure in the form of positive upside breadth continue to drive the markets higher? We now have a few more weeks of uncertainty as congress tries to agree on a budget. Without any clear resolution on the budget and the China trade war, we feel the next few weeks could see some choppy range bound action after the massive run up off the December lows. Couple that with pension funds rebalancing about $8 billion is stock sales a pullback or consolation of the prior month's strength would make sense. We expect a slow down in growth, but the economic back drop remains favorable. The strong breadth thrust should carry this market higher eventually, and if we get some resolution to the trade war this market could kick into overdrive.


