Wednesday, August 1, 2018

August and Seaonality

As the S&P 500 embarks on a four month winning streak we wanted to look at how seasonality plays out the rest of the summer.  So far the market has enjoyed a nice summer rally with a healthy gain in July.  However, if we turn to August we can see the potential for some summer angst.

 Looking at August data:
  • Last 20 years: August ranks dead last in monthly performance with an average loss of 1.02%
  • Last 20 years: August has the highest average draw-down from the prior months close while the second lowest draw-up from prior months close
  • Last 20 years: The average daily trend starts weak and finishes at the lows
  • Last 20 years: August is the third most volatile month
  • Since 1950: August ranks second to last in monthly performance with an average loss of 0.09%


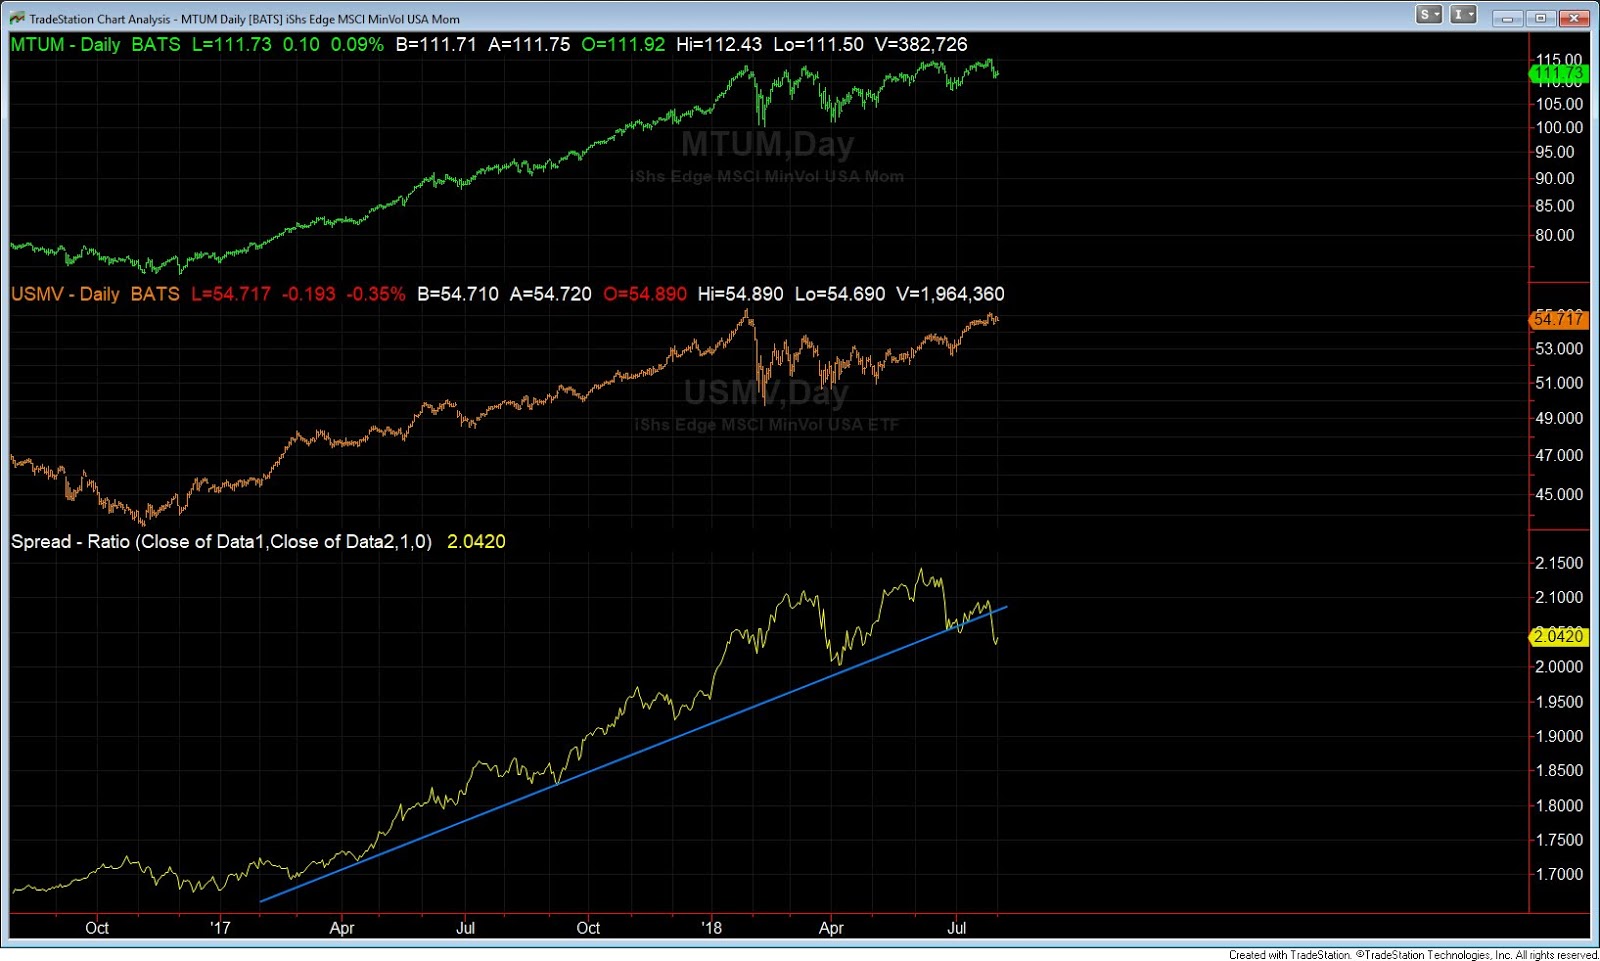
The momentum trade started to breakdown the last few days of July.  Lets look at some ratio charts to possibly confirm rotation into more defensive names.  The first two charts compare momentum to low volatility.  Both are breaking down below their lower trend line support.  The last chart is a ratio of consumer discretionary to staples.  What all three have in common is that lower volatile and more defensive names are outperforming recently.  Does this confirm the trend has changed?  The evidence is not resounding enough just yet to substantiate this rotation.  Yet, this is something we'll closely monitor as we enter August. 


The bull market in equities continues with most indices at new monthly closing highs or very close.  We touched on breadth in our last post and with the recent breakdown in momentum stocks we could be in for some short term pain.  Couple that with the weak seasonality of August and September could set the stage for better entry levels lower before the bull resumes higher. 

Thursday, July 19, 2018

Is current breadth worrisome?

Price action remains bullish as the Nasdaq is at highs and small/mid caps are within spitting distance of new highs.  The S&P is above the 2800 resistance level as the NYSE and Dow remain in consolidations.  It is a good exercise to look under the hood to see what is driving the indices and see if we can gain any insight.  The one thing that worries us is the lack of breadth has not followed price action higher.  The overall Advance/Decline line in the Nasdaq and S&P remains bullish yet some more subtle shorter-term breadth figures paint a different story.  Below are some of the breadth indicators showing negative divergence:
  • Nasdaq new 52 week highs
  • Nasdaq % of stocks above 50 and 200 day moving average
  • S&P new 52 week highs
  • S&P % of stocks above 50 and 200 day moving average


For the indices to maintain new highs or recent strength they will need to have broad participation to follow though to the upside.  With the VIX at complacent levels it won't take much to spook the market especially with thin leadership.  This will be something to watch over the next few weeks as a plethora of earnings are released.  Will participation escort price to new highs or will price succumb to a lack of leadership and retreat?  

Monday, July 2, 2018

Halftime Report

We have reached the half way point for the calendar year and wanted to take the opportunity to review the report card from a performance stance.   We like to start from the top down and then drill into some sector work.  This will gives us a good idea of what is leading and lagging and some of the themes associated that has driven returns.

With that said, lets take a look at a performance map from the first half.  A great resource that does this in a concise manner is finviz.  Below are some observations:
  • US markets are the clear leader versus international developed markets.
  • US small caps outperforming large caps.
  • Emerging markets are lagging with Brazil and China dragging on performance.
  • Fixed income has not been a safe haven to park cash.
  • Commodities are a mixed bag with oil leading the pack higher.
  • US dollar is the strongest developed currency. 
  • Volatility has perked up versus last years doldrums.
  • Retail, biotech, technology, and oil and gas producers are the first half winners.
  • Industrials, consumer staples, and financials are the first half losers. 

It has been a hectic first half of 2018 compared to the quiet trending markets last year.  After a blistering start to the year when the S&P gained 5.6% in January the S&P experienced its first 10% pullback since February 2016.  The S&P dropped 12% and 9% in the first half while the VIX index more than doubled.  However, after all the volatility the S&P produced a modest gain on the year and is clearly outperforming international and emerging markets.  With all the talk of trade wars, it seems the US is winning the war of words strictly on a performance basis.  A simple ratio chart comparing the S&P 500 to the Dow Jones Shanghai index reveals the relative performance of the US vs. China.


One area of weakness that has piqued our interest and something we'll continue to monitor is the action in the Dow and NYSE index.  Both indices have been the worst performers of the 5 major US domestic indices as they both have produced losses for the first half.  Both are sitting on trend-line support that goes back 2 years.  If these levels break it could warrant further downside especially as we enter the heart of the summer doldrums as liquidity dries up and can generate erratic price action. 


When we drill down to sectors there are clearly some surprises that pundits didn't see coming at the beginning of the year.  Most forecasts saw rising rates bullish for banks and financials.  However, instead of a steeping yield curve it has narrowed putting pressure on the banking sector.  The one bright spot has been regional banks within financials.  Tech remains one of the leaders but maybe the biggest shock year-to-date is the emergence of retail as a leadership group.  Most talking heads had brick and mortar left for dead as Amazon takes over the world.  One interesting trend we follow is the ratio chart comparing high beta to low volatility.  High beta stocks have been outperforming since   2016.  However, momentum has been sucked out of high beta names over the last few weeks as this ratio is testing the lower trend-line.  Are we about to see a rotation into more stable lower volatility names?  This is definitely worth watching.


Going further into the micro level if we look at what July has to offer from a historical perspective there is not much to gain.  July ranks right in the middle of the pack for average monthly gains over the last 20 years as it manages to eke out a small profit of 0.37%.  The daily monthly trend shows that gains peak in the middle of month and fade towards the end of the month.  One bit of good news from a contrarian perspective is sentiment remains very low as expectations have drastically come in the last few months.   


The first half of 2018 certainly felt different than the easy trading environment of last year.  As the markets continue to find its footing there are some pitfalls and themes over the next 6 months that could heighten volatility.  These include:
  • Geopolitics
  • November elections
  • Trade and tariffs
  • Italy's political challenges and banking system
  • Fed and rate increases
  • China's devaluation
  • Valuations, debts, and deficits
Following the performance trends give us a glimpse of the winners and losers and where money is flowing.  It also proves that following conventional wisdom isn't always the best strategy.  Looking outside the box can unearth sizable opportunities where the obvious might be wrong.  While the market climbs the proverbial wall of worry, we observe the data and trends to guide our decision making process.  The one theme that dominates is the relative strength of US domestic instruments.  Couple that with the strongest developed economy keeps us in the bullish camp on US equities.  2018 has proven it won't be easy and there remains plenty apprehension, yet we continue to favor buying equities into weakness and riding the current momentum.  

Have a wonderful and safe 4th of July!


Wednesday, May 30, 2018

So much angst yet New Highs?

The markets stumbled yesterday with blame be attributed to the surrounding future of the Italian government.  Volatility spiked and yields throughout the world saw big moves in both direction as the risk off trade set in.  In a flight to safety US bonds were bought as it remains to be seen if this is a localized Italian issue or a contagion the rest of the world will deal with.  Obviously we don't know the outcome but with US indices rallying today along with US small caps making new highs we believe this will be a contained issue.  The Russell 2k is getting overbought and is one area we are watching.  However, the other three big indices (S&P 500, Nasdaq, Dow) all have plenty of room to run before excessive conditions kick in.       


An interesting stat from sentiment trader confirms that volatility is most likely to calm down instead of continuing higher after a big 1-day jump.


When we drill down into the returns of S&P sectors over the last month we can see how it paints a mixed bag.  Defensive names and financials have been a drag on performance while technology has reasserted leadership.  Oil has been on a massive run higher the last few months but has recently corrected on rumors that OPEC and Russia will ease production caps. 


From a seasonality perspective will still remain in the weakest 6-month stretch.  However, if one traded that religiously you would have missed out on a decent month so far in equity markets.  The good news from a contrarian standpoint is that sentiment remains subdued.  The CNN Fear and Greed Index is actually showing fear while cash remains high at 4.9% based on the May BAML survey. 

In the next two days there will be a host of economic numbers released.  Based on estimates and the last data points the ISM reflects a growth environment while the unemployment rate is the lowest since December 2000.  Assuming we don't get any big surprises in the wave of data, the Fed is apt to stay on course in their hiking cycle the balance of the year. 

What does it all mean?  As breadth continues to improve and with small caps trading into new highs we want to stay long risk assets as the remaining indices should try and follow the direction of small caps into new highs.  The economy remains strong and the Fed is transparent in their approach to raising rates.  Couple this with muted sentiment the potential for a summer rally is real.  The wild card remains geopolitical affairs and the systemic risk from Italy but so far these events have been short lived and contained. 

Tuesday, May 1, 2018

Sell in May and Go Away - Really??

Most market observers have heard the old adage "Sell in May and Go Away".  As with all statistical analysis you have to look deeper into the data and not take it at face value.  While it is true the next 6-month stretch is the worst for the S&P going back to 1950 (1.59%) not all is negative.  Five of the last six years saw a positive May through October posting an average gain of 4.8%.  Also if you take into context where the long term trend of the S&P resides the data tells a different story.   If the S&P is trading above the 10-month moving average, the May-Oct time frame still shows the weakest 6-month return however it boasts a gain of 2.45% and positive roughly 70% of the time.  On the flip side, if the S&P is trading below the 10-month moving average the average loss is -2.04% and only up close to 50% of the time, which ranks second worst in performance only behind April-Sept. 


 Looking at May data:
  • Last 20 years: May ranks 7th in monthly performance with an average gain of 0.05%
  • Last 20 years: The average daily trend is trend-less swinging back and forth
  • Last 20 years: May is the second least volatile month
  • Since 1950: May ranks 8th in monthly performance with an average gain of 0.24%
  • Since 1950:  May is higher almost 60% of the time and ranks 8th in volatility


Given the state of the current environment featuring higher volatility and choppy waters we don't want to totally ignore the seasonality statistics.  We are more concerned with the overall trend in the market.  However, with the S&P barely above the 200 day coupled with a declining 50 day moving average we are willing to be patient in this market.  If the S&P can rally and stay above an upward sloping 200 day moving average the old adage of sell in May and go away may prove worthless. 

Wednesday, April 18, 2018

Poised to run higher


After yesterday's strength all four of the major index's are now above their respective 20, 50, and 200 day moving averages.  This along with a positive divergence in breadth is a good sign.  With the A/D line breaking out to new highs on the S&P the index's are set up to follow through with strength.   Breadth in the form of sector participation is also healthy as all 10 of the major S&P sectors are now above their 20 day moving average.  Even ex-US index's are pulling their weight as the majority are above their 50 day moving average.  From a trend and breadth perspective the narrative has become more bullish the last few days. 


If we turn our attention to the April fund manager survey we can gain some insight into fund managers positioning and sentiment.

Below is a recap of the April FMS:
  • Bulls silenced, not routed: risk assets can bounce, but SPX 2550-2850 range holds 
  • Cash jumps from 4.6% to 5.0% (Exhibit 1), equity hedging levels @ 18-month highs…
  • …18-month lows in FMS global growth & profit expectations, equity allocations…
  • …and record # investors say companies excessively levered
  • But true FMS bull capitulation absent…just 13% say recession likely, only 18% say stock bull market has peaked…
  • …and asset allocators still married to TINA (there is no alternative - equities>bonds) until UST10Y hits 3.5%
  • #1 “tail risk” = trade war (China, Germany markets most vulnerable)
  • Top “crowded trades”: #1 long FAANG+BAT, #2 short US$, #3 long credit
  • April rotation out of stocks, tech, banks, Japan; tech allocation lowest since Feb’13 on Occupy Silicon Valley & trade fears
  • April rotation into cash, commodities (8-year high), energy, UK (biggest post-Brexit)
  • FMS contrarian trades: long government bonds; long US dollar, short EM equities; long liquid defensives (e.g., pharma, staples), short cyclicals (banks, consumer discretionary)
FMS cash jumped 0.4% to 5% continuing the FMS cash rule contrarian "buy" signal.  Allocations to global equities fell to 18-month low of 29% from net 41% overweight in March.  Allocation to commodities rose 4% to 6% overweight, the highest since April 2012 when WTI was $105/bbl.  Meanwhile investors that are hedging their portfolios is at an 18-month high. 


Is the worst behind us and is the market poised to run higher?  The weight of the evidence confirms the trend has turned higher with a positive confirmation in breath.  There is certainly plenty to worry about with trade wars, Syria, and the Fed.  However, with earnings season about to get into full swing coupled with tepid sentiment, the foundation is set for a test of new highs. 


Tuesday, March 20, 2018

Post Correction

It has been about a month since the market bottomed and corrected roughly 12% from peak to trough in all of 10 trading days.  Since the trough low and reversal day on February 9th the S&P has rallied 10% off the lows in a choppy fashion.  The leader from the lows has clearly been in technology stocks as both the Nasdaq and NDX have rocketed back to new highs on their rally attempts.  The current weakness has taken both of these indices below their prior highs creating a potential double top.  The good news is the big four indices have made higher lows over the last month setting up a wedge formation.  What is more concerning is the negative divergence in momentum and breadth that has been created as price was making new highs in the Nasdaq and NDX.  Both the RSI and % of stocks trading above their 50 day moving average failed to confirm new highs.  Typically markets roll over when not accompanied by strong breadth and momentum readings.


Another area we'll be watching on a longer term chart is the 20 week moving average accompanied by the bollinger bands.  Urban Carmel over at the Fat Pitch blog had a nice review of how this has played out in prior instances.  "It's a reasonable guess that the next time the 20-wma is tested, it will break and SPX will complete its full retest of the February low. It's also a good guess that a trip to the lower Bollinger is in store for 2018. The long uptrend in 2013 weakened in 2014 and ultimately broke at the end of that year."(See Chart Below)  If he is right and the S&P doesn't hold the 20 week moving average we could be heading to the lower bollinger band around 2550 which would bring in a test of the February lows. 


Since the February 9th bottom, performance has been led by tech and financials.  However, if we break down the performance among S&P sectors over the last month we can see an interesting trend.  Technology still leads the way as the dominant sector as we discussed above but the second biggest move has been utilities.   This has a defensive undertone.


If we turn our attention to the monthly BAML survey to get a read on fund managers sentiment and positioning it can confirm some of our own findings.  The most crowded trade is long FANG stocks while short volatility slips to sixth from 1st in January.  At the same time, March rotation shows investors reducing risk by increasing defensive allocations.  Not surprising, threat of a trade war is back as the biggest tail risk for fund managers overtaking inflation.  74% of investors now believe the global economy is in "late cycle", the highest on record.  Respondents think 3.6% is the "magic number" to cause investors to rotate from equities back into bonds while 58% of FMS investors think global corporate earnings will rise 10% or more over the next 12 months. 


The market sits at an important juncture after rallying off the February lows.  The next few days and weeks will go a long way in determining the direction of the trend.  If the downside of the wedge pattern and the 20 week moving average give way it could set up a test of the February lows.  If the market holds current levels and breaks to the upside there could be a sprint to new highs that catch traders flat footed.  For the trend to resume higher it will need to be accompanied by breadth and broader sector participation outside of technology.  With expectations that earnings will continue to grow we believe any pullbacks should be well contained.  However, considering the highest recorded reading of investors believe the global economy is in the late cycle phase we still expect to have bouts of heightened volatility.  Tomorrow's FOMC meeting will give us plenty to talk about with regards to the economic outlook, bond yields, trade wars, and the Fed's positioning.