Sunday, August 21, 2016

Week In Review: Checking Sentiment & Breadth

Big cap stocks essentially went nowhere this week as the S&P 500 was down a whopping 1 basis point.  Some of the "risk-on" traits we've recently highlighted continued however as small caps (Russell 2000) showed relative strength and were up 60 basis points over the last 5 days.  All in all, the marketplace still seems to be digesting the fast and furious gains that were made in late June and early July.


With that in mind, we wanted to take a look at some of the forces at play that will determine whether the recent trend continues higher.  In the very near-term, we continue to see some negative divergences and short-term warning signs that will need to be worked off but overall things continue to look healthy for higher prices.  Hopefully any pullback will be similar to some of the past instances shown in our last blog post i.e. shallow and short

Breadth
  • We're seeing some short-term negative divergences as the % of stocks above their 10, 20, and 50 day moving averages peaked out in July (1st chart)
  • Also, the number of 52-week new highs on S&P peaked in July  (2nd chart)
  • Good news is the longer-term looking indicator of % of stocks above their 200-day is hitting highs with the market
  • The advance-decline line is also confirming price strength (A-D line in yellow in 2nd chart).  This is a good thing.


Sentiment
  • Plenty of cash is still on the sidelines as shown by the 5.4% cash weighting of fund manager allocations (this according to the BAML Global Fund Manager Survey).
  • Managers are also only 9% overweight global equities which is almost a full standard deviation below the historical average.
  • CNN Fear and Greed Index is has gotten excessive and is now flashing "extreme greed."
  • AAII survey is at 5 week high but bullishness is still below historical average.  Still very high neutral readings.


AAII Sentiment Survey:

Optimism is at a five-week high, as more than one out of three respondents described themselves as bullish for just the sixth time this year. 

VIX

The VIX term structure remains historically low but as we have shared in previous posts this doesn't necessarily mean we should be ringing alarm bells.


In the short-term there are a few negative divergences worth watching coupled with some sentiment measures being a bit overheated.  This becomes even more important as we enter September which has historically been the worst month of the year.

However, this is also to be expected at the beginning of what could be a new uptrend.  The so-called "wall of worry."  Case in point, according to the monthly BAML fund manager survey, investors are still pessimistic with only 23% of fund managers expecting a stronger economy in the next year. This explains their low allocations to equities and high allocations to cash.  However, the potential for more to hop aboard the bullish thesis could put a healthy bid underneath the market and keep prices propped up.


Sunday, August 14, 2016

The VIX Keeps Going Lower and The Market Higher: How Long Can This Last?

There's been a noticeable pickup in VIX-related talk and headlines over the last few weeks.  Case in point, Bloomberg published this story on Tuesday:


US large cap stocks have essentially jogged in place since mid-July.  In fact, per the Bloomberg article, the "S&P has failed to rise or fall more than 1 percent in either direction for 22 straight days, the longest streak since 2014."  As this sense of relative complacency has overcome the marketplace, the CBOE Volatility Index (VIX) has fallen to a more than two-year low.  At this point with volatility crushed the way it's been, it's fair to ask "what's next?"

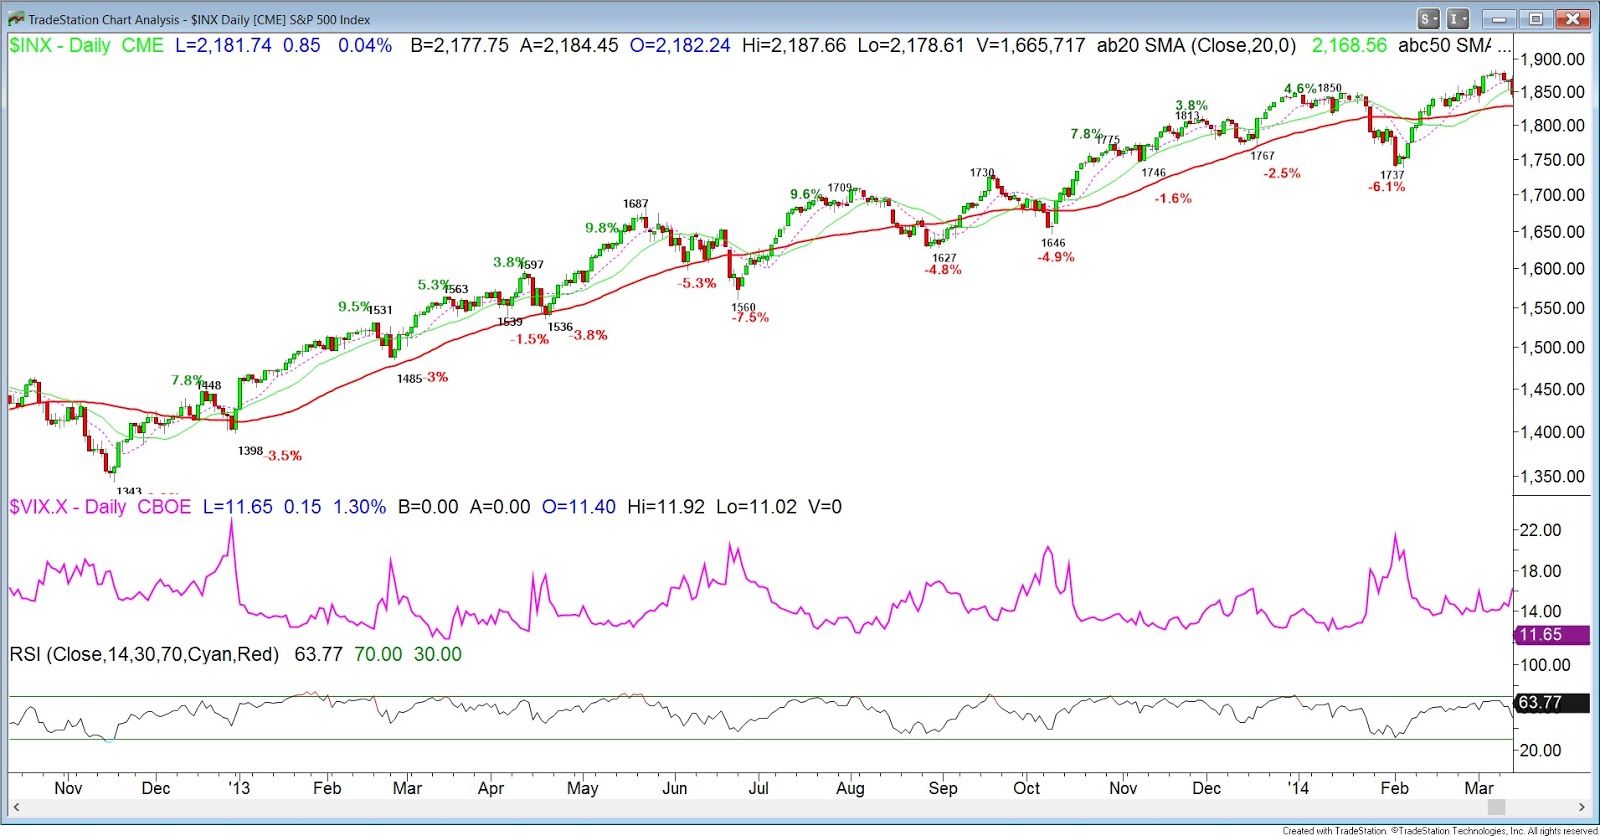
We scrolled back into the past in search of similar market environments.  Our general search criteria looked to identify instances where the market trended higher for months and were characterized by declining to flat volatility and persistent overbought conditions as judged by the 14-day RSI.  We also wanted to see the market essentially riding its 20-day moving average higher with max pullbacks being contained and respecting the 50-day moving average.  We wanted the pullbacks to be quick and shallow.

Below are past market periods that exhibited these traits.  We included the S&P's performance over that time and the largest pullback during that stretch:

Dec 1994 - July 1995 27.09% (-2.3%) - After a very narrow 24 month range similar to current market
 
March 2003 - June 2003 28.6% (-5.8%)

July 2006 - Feb 2007 19.4% (-2.4%)

March 2007- June 2007 12.9% (-1.5%)

*Excluded 2009 as it was a huge year and bounce off bear lows and would act as outlier.  Wanted to compare more normal periods.*

Feb 2010 - April 2010 16.9% (-2.3%)

Sept 2010 - Feb 2011 29.4% (-3.3%)

Nov 2011 - April 2012 22.8% (-5.1%)

Jan 2013 - April 2013 14.2% (-3.5%)

Oct 2013 - Jan 2014 12.4% (-2.5%)

Feb 2016 - April 2016 16.6% (-2.8%)

June 2016 - ???

The average move is 20.03% with the average pullback at -3.15%.  The moves lasted between 3 and 8 months.  These results are further supported by a study this week by Mark Hulbert where he evidenced that a low VIX is not necessarily a sign of pending trouble for stocks.


Dr. Brett Steenbarger recently posted yet another great piece about market understanding.  Part of being a successful trader is identifying the current market environment and adapting to the conditions.  Trending markets are very different from choppy markets and the opportunity sets within are not the same.  The most difficult part in this process is identifying inflection points of when we're moving from trending to choppy and vice versa.  As a discretionary trader you have to weigh the evidence presented and make your bets from there.

After 2-years of choppy, range-bound trading the S&P 500 has broken out to the upside and made new all-time highs.  So if we have in fact entered into a trending environment, you'll want to be long the market, searching for relative strength and buying any weakness.  However, pullbacks are likely to be quick and won't give you much time to buy in.

Below are a few examples of the trending periods that we highlighted above.  They show price trending and a flat to declining vix (middle panel).   The 14-period RSI is shown in the bottom panel as price remains overbought throughout the move.

1995

2006-2007

2010

2013

2016


Sunday, July 31, 2016

Week In Review / July Recap

The S&P 500 continued to take a bit of a breather this week as it continued to digest late-June's / early-July's strong gains.  The index finished the last five days of the month essentially unchanged, falling just 0.07%.

And to be honest, "a bit of a breather" is an understatement.  Over the last two trading weeks, the index has stayed in one of the tightest ranges in its history.  In the last 11 days, the S&P has traded in a 0.61% range (based on closing prices) which makes it the tightest movement over that timeframe since August of 1995.  The research team at LPL Financial ran the numbers on how these tight ranges have tended to resolve themselves.  A number of other research groups also made note of the dull market conditions over the back half of the month.


The NASDAQ on the other hand continued to power higher with an assist from upside earnings surprises by a number of tech's biggest names including Facebook, Apple, Google/Alphabet and Amazon.  The index finished the week with a gain of 1.2%, leading all of the major US equity indexes.


Along with the NASDAQ, the Russell 2000 was also able to finish the week in the black.  This was a theme that played out over the entire month as small caps and the NASDAQ led the way higher with each up more than 5% in July. 


After the massive rebound off the Brexit chaos, all US stock indexes sit comfortably in positive territory in 2016 as we enter the seasonally challenging August - October timeframe.

As the markets and the economy have accelerated in recent weeks and proven immune (for now at least) to whatever fallout may come from Brexit, we've seen renewed talk of the possibility of the Federal Reserve moving to raise rates before year-end.   And while those discussions may have picked up in pace, futures markets are still betting against such a move.  Per Briefing.com: "Rate hike expectations receded throughout the past week. Since last Friday, the implied probability of a rate hike in December, estimated by the fed funds futures market, declined from 47.8% to 33.0%. The fed funds futures market does not expect the Federal Reserve to depart from its current target range until after July 2017."

As mentioned above, August and September have tended to be some of the more volatile months for stocks.  Urban Carmel noted that since 1945 of all the months where the S&P has fallen 5% or more, August and September have combined to provide more than a third of them.  Additionally, August has proven to be the weakest month on average for the S&P over the last 20 years.


So we go into August with stocks at all time highs, trend and breadth looking remarkably strong, earnings season has been respectable and the economic data points suggest a turn better.  Couple that with the tendency for tight ranges like we've seen in recent weeks to resolve higher and it's easy to anticipate further gains for equities.  However, one must consider the historical seasonal weakness of the coming 30-60 days and be prepared for the potential of another quick pullback.  

Timeframes are everything right now and we're prepped with an open mind to consider all scenarios.


Sunday, July 17, 2016

Week In Review (7/11 - 7/15)

The markets continued their post-Brexit giddiness this week by gapping higher at every open and finishing higher every day but Friday.  All told the S&P was up 1.15% for the week and sits higher by 3% so far in July.


It wasn't just US stocks that traveled higher this week as international and emerging market stocks (EFA & EEM), commodities, bonds and the US dollar all made advances.  

The S&P is now attempting to confirm its recent breakout to new all-time highs and hold above the 2,130 level that stayed insurmountable for over a year.  We continue to see incredible breadth measurements that suggest this time may be the real deal.  Yet n the very near term we wouldn't be shocked see stocks back off a bit as we're just a little overheated here.  At the same time, the VIX has had a tendency in the past to bounce at these levels (closed Friday at 12.67) suggesting that a pickup in volatility is due.  And as earnings season kicks into high gear this week we may now have the ingredients necessary to see that happen.

We wanted to share a recent study we ran in search of finding markets with similar characteristics.  One that produced some interesting results (no bias here) had the following constraints:

-We used the Dow Jones Industrial Average through June 30th
-We looked for markets with a down trending 200-day (40-week) Moving Average
-We wanted to see a recent uptick in this moving average (weekly close greater than prior week)
-And we wanted to be within 6% of highs on the Dow

Below are all the instances going back to the 1950s and there's some takeaways to note:

1) The average returns are slightly weaker almost across the board relative to the entire sample

2) There's notable weakness in the forward 2 and 3-month timeframes


We've seen some stories comparing the current market to 97-98 currency crisis markets but one big difference we'd be quick to note is that from 1995 to 2000 the 200-day MA on the Dow was trending up pretty much the entire time.  A more similar market might be from 1956-1958 (seen in 2nd chart below) where you actually had the 200-day MA flatten out/decline for a period of time much like now.  That market whipped around for a few years, experienced a decent sized flush and then went on to put in much higher highs from 1959 onward.

We'll see if the breakout that's underway can sustain and we're able to buck the trend of the 2 and 3-month weakness that we've seen in past instances.

1983-2016


1950-1983 - *(1956-1958)*


Monday, June 27, 2016

Brexit Correlations

With the "Brexit" decision looming over markets last week we got a fresh reminder of just how tightly asset classes are correlated when the market receives an unexpected shock.  This was the case when Britain, to the surprise of most, voted to leave the European Union.  US government bonds, the dollar, Yen and precious metals all soared higher while global stocks, the Euro and oil got hit hard upon the outcome of the vote.


VIX Term Structure:

Since the start of this sideways, choppy market environment in late 2014 when the VIX term structure has gone above 1 that has been a short term buying opportunity.  Will this time be different??


Sunday, June 19, 2016

Week In Review (6/13 - 6/17)

Domestic Index Performance (Past Week)

Domestic Index Performance (June)

Domestic Index Performance (Year-To-Date)

Below is an excerpt from our latest monthly letter to investors & friends that we think sums up the current state of affairs:
If one were to give a theme to the market action and data points we saw over the course of May and so far in June, the word indecision would play well. In early May, it was all but a given that the FOMC and Chair Yellen were not likely to touch interest rates until much later in the year and fed funds futures prices were reflecting that belief. As the month carried on though the market seemed to make an about-face after a number of Fed officials came out and suggested that an increase at their June policy meeting could be warranted. In fact, the minutes from the committee’s April meeting (released in mid- May) echoed that same sentiment:
"Most participants judged that if incoming data were consistent with economic growth picking up in the second quarter, labor market conditions continuing to strengthen, and inflation marking progress toward the Committee's 2.0% objective, then it would likely be appropriate for the Committee to increase the target range for the federal funds rate in June."
As a result, over the course of a week the fed funds futures market’s probability of a June rate hike jumped from 8% likelihood to over 30%. And the likelihood of a July increase leapt all the way to 55%. And the market appeared to cheer all of this news as it coincided with the rally that held through the end of May and into the beginning of June. Then we got the latest Non-Farm Payroll report on Friday, June 3rd and it was a real stinker. Only 38,000 new jobs were created versus an expectation of 170,000. The April and March numbers were also revised lower by a total of 59,000 jobs. These developments left the trailing 3-month job creation average at 116,000 versus the 12- month average of 212,000 jobs. Not exactly a glowing endorsement of the economy or the Fed’s hope to move forward with a near-term rate increase. And now with the June Fed meeting having come and gone, we know that the jobs report along with other recent economic data was enough to push off a rate hike until July at the earliest.
As the Fed has been doing its job of throwing more confusion into the crowd, there’s been a clear ramp in volatility over the last several days. In fact, the VIX aka the fear index made a near 60% surge over the course of the last week. One could have normally expected the market to wilt in the face such increased volatility yet the S&P was down less than 1% over that span. This stands in complete contrast to historical precedent as the market has averaged a drop of nearly 7% when the VIX has risen 55% or more in a given 6-day period. In addition to the Fed’s lack of movement, the rise in volatility has been aided by investor nervousness in advance of the “Brexit” vote (the British referendum to exit the European Union). It appears investors are doing their positioning on whether Britain will stay or leave via the options market and this has made the VIX even more spastic.
One thing is clear, when we examine the chart below we see that the market has held a great deal of angst ever since the end of QE3, onward through the first rate increase in December 2015 and to present day as we wait to see what will finally push the Fed into action for rate hike #2. There’s been essentially zero price progress made by the S&P in the last 18 months.

Further, besides the charts, there are plenty of other data points that show the level of indecision held by investors and fund managers right now. Bank of America/Merrill Lynch’s latest global fund manager survey shows that despite corporate bond prices and US stocks being at or near all time highs, there appears to be great amount of unease. In fact, BAML’s June measure of fund managers’ allocation to cash in their portfolios was at its highest mark since the post-9/11 panic in November 2001. Higher even than at the depths of the 2008-2009 financial crisis. At the very least, this measure shows that fund managers worldwide are simply running out of ideas for where to invest capital and would rather hold cash. Couple that with the survey’s respondents voting “long quality stocks” (think US Large Caps) as being the most crowded trade and you get a better idea of just how hated the recent moves of the S&P 500 might be. But be aware, these data points have a tendency of being contrarian in nature. BAML’s measure of fund managers’ cash levels sits at 5.7%. It was at 5.6% during the year-to-date lows in February and the S&P proceeded to rally 17% from that level. The same goes for November 2001, which was not a bear market low, the S&P managed to rise 10% over the next 2-months. The difference today being that we’re within earshot of all-time highs yet cash levels are abnormally high.
Have a great week.


Wednesday, June 8, 2016

New Highs Are In Sight & What That Might Mean

There's been much talk lately about the length of time that the S&P 500 has now gone without making a new high.  In fact, May 19th marked the 252nd consecutive trading day (equals one calendar year) in which the index had gone without registering a new high mark.  With the S&P now just 70bps (currently 2,118) away from eclipsing its all-time high of 2,134, we wanted to look at past instances where the index had gone at least a calendar year without setting a new peak and how it performed once it did gain new high ground.

Going back to 1950, there have been 13 instances where the S&P went at least 252 trading days without making a new high.  However, once the index has been able to gather the steam to breakout to the upside, the forward looking returns have been rather encouraging.  We looked at 1, 3, 6 and 12-month returns and the average, median and max performance are all very strong and can be seen in the table below.

S&P 500 Performance: When Index Goes At Least 252 Trading Days Without New High


We then took the study a step further in an effort to account for the environments in which these moves occurred.  By our count, 9 of the 13 episodes happened in the midst of secular bull markets.  As you can see in the stats above, the average returns for those periods alone are even more powerful with forward 12-month returns sitting at nearly 18%.

In the 4 occasions where the index took at least 252 trading days to make a new high while in a secular bear market (end dates: 1972, 1980, 2007, 2013), the average performance, while still positive, was much weaker than the total sample size.  Forward 12-month returns averaged just 3.28%. Also note the huge divergence in time taken to make a new high between secular bulls vs bears.

We've shared some charts of the secular bull/bear periods for the S&P and Dow below for further reference:


If stocks are able to stay firm here and make a sustained push through the 2,130 level, history suggests that favorable odds for further gains could be in the offing.  This would be a nice set of data for bulls as they seek to combat all of the negative seasonal conditions that are prone to occur in the summer months aka Sell in May & Go Away...

In looking at many of the recent sentiment and participation measures it's easy to see that very few investors had anticipated or positioned for the market to be testing new highs.  Particularly given that markets were making fresh 12-month lows just a short time ago in mid-February.  But perhaps there's more time to participate in this latest up-move.  Jason Goepfert of SentimenTrader noted in Barron's over the weekend that, going back to 1928, there have been 14 years in which the S&P posted 3 consecutive months of gains after making a 12-month low (which is what we had this year where 12-month low made in February and then March, April, May all logged gains).  In 12 of those prior 14 years, the market continued rally for at least another 3 months.


"Goepfert sees parallels between now and 1953, when stocks underwent a minor correction after a multiyear bull market.  Then, as now, the advance/decline line hovered near its all-time high and market breadth was strong.  Mimicking 1953 would be the best of all scenarios: The S&P rose 24.7% in the nine months following the 3-month signal and went on to return 83.8% two years out."

We're not quite ready to be that optimistic but the market has certainly flashed some encouraging signs as we head into the historically challenging summer months.