
US large cap stocks have essentially jogged in place since mid-July. In fact, per the Bloomberg article, the "S&P has failed to rise or fall more than 1 percent in either direction for 22 straight days, the longest streak since 2014." As this sense of relative complacency has overcome the marketplace, the CBOE Volatility Index (VIX) has fallen to a more than two-year low. At this point with volatility crushed the way it's been, it's fair to ask "what's next?"
We scrolled back into the past in search of similar market environments. Our general search criteria looked to identify instances where the market trended higher for months and were characterized by declining to flat volatility and persistent overbought conditions as judged by the 14-day RSI. We also wanted to see the market essentially riding its 20-day moving average higher with max pullbacks being contained and respecting the 50-day moving average. We wanted the pullbacks to be quick and shallow.
Below are past market periods that exhibited these traits. We included the S&P's performance over that time and the largest pullback during that stretch:
Dec 1994 - July 1995 27.09% (-2.3%) - After a very narrow 24 month range similar to current market
March 2003 - June 2003 28.6% (-5.8%)
July 2006 - Feb 2007 19.4% (-2.4%)
March 2007- June 2007 12.9% (-1.5%)
*Excluded 2009 as it was a huge year and bounce off bear lows and would act as outlier. Wanted to compare more normal periods.*
Feb 2010 - April 2010 16.9% (-2.3%)
Sept 2010 - Feb 2011 29.4% (-3.3%)
Nov 2011 - April 2012 22.8% (-5.1%)
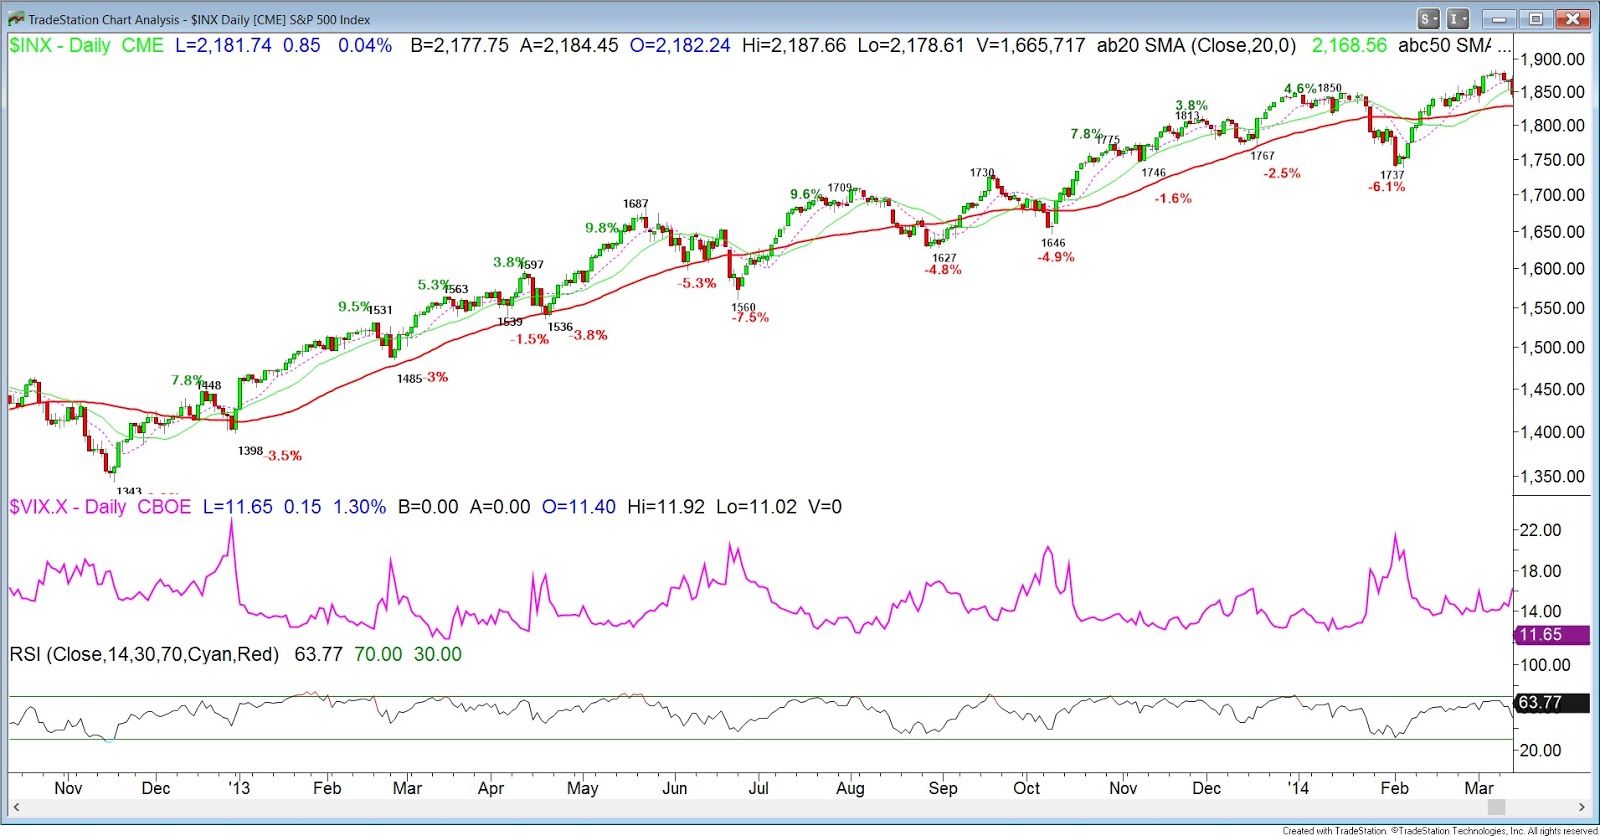
Jan 2013 - April 2013 14.2% (-3.5%)
Oct 2013 - Jan 2014 12.4% (-2.5%)
Feb 2016 - April 2016 16.6% (-2.8%)
June 2016 - ???
The average move is 20.03% with the average pullback at -3.15%. The moves lasted between 3 and 8 months. These results are further supported by a study this week by Mark Hulbert where he evidenced that a low VIX is not necessarily a sign of pending trouble for stocks.

Dr. Brett Steenbarger recently posted yet another great piece about market understanding. Part of being a successful trader is identifying the current market environment and adapting to the conditions. Trending markets are very different from choppy markets and the opportunity sets within are not the same. The most difficult part in this process is identifying inflection points of when we're moving from trending to choppy and vice versa. As a discretionary trader you have to weigh the evidence presented and make your bets from there.
After 2-years of choppy, range-bound trading the S&P 500 has broken out to the upside and made new all-time highs. So if we have in fact entered into a trending environment, you'll want to be long the market, searching for relative strength and buying any weakness. However, pullbacks are likely to be quick and won't give you much time to buy in.
Below are a few examples of the trending periods that we highlighted above. They show price trending and a flat to declining vix (middle panel). The 14-period RSI is shown in the bottom panel as price remains overbought throughout the move.
1995

2006-2007

2010

2013
2016
