Wednesday, December 31, 2014

A Look Back On 2014

The last two weeks of every year, Wall St. firms and others trot out their various strategists to offer predictions for the year to come.  Why? We have no idea.  They serve very little purpose and most are cloaked in generalities that provide little in the way of actionable advice.  Typically you'll see similar calls/expectations out of each firm and only a few rogue individuals willing to go out on a limb.  And this is entirely understandable, these strategists and portfolio managers take on far less career risk by not straying too far from the herd.  This is the very same reason we've started to see so-called "actively" managed funds appear to resemble their benchmark index.  By hugging the benchmark and/or the herd, career risk is presumably lessened.

While these forecasts are not all that helpful, year-in-review commentaries can be useful.  By gathering commentary from others and/or performing your own review, you can uncover the major themes of the year and how they might have impacted your decision making.  For example, here, Josh Brown quickly lays out 4 macro themes that went down in 2014 and the major themes of years past.  While this article is obviously very brief, it and others like it could serve as a blueprint for one doing their own annual review.  

For instance, Josh highlights the performance of US stocks - specifically large caps - as being the best game in town for equity investors.  This is definitely true.  US Small Cap stocks were a complete chop fest all year and the major international benchmarks were by and large portfolio drags.  However, even with US Large Caps it was not the easiest of years regardless of what the indexes might say.  Unless you were a passive, long-term holder of the benchmark (use the S&P as our example) with literally no intent of selling, you probably got a little fidgety at points.  As in 2013, we saw numerous "V-Bottoms" over the course of this year that left risk conscious investors with difficult decisions to make.  The S&P 500 has now gone 3 years without a true 10% correction however 2014 saw no less than 4 considerable pullbacks (highlighted by September/October's 9.9% decline).  These moves threw many investors for a loop because on each occasion the index would swiftly and violently put in a V-bottom and recover to new highs within days.  What's more, there was significant damage done to many individual stocks during these index declines making it even more challenging for stock pickers.


While many will argue that this year was a win for passive-index investors, unless you allocated nearly 100% of your equity portfolio to US Large Caps (not likely according to our anecdotal research) you did not perform in line with the S&P.  Further, once the other asset classes that make up the typically allocated portfolio (small caps, international stocks, commodities/currencies, bonds) are factored in, the average investor almost assuredly did not outperform the S&P.   

So, for us, a few more key takeaways: 

1) We intend to revisit the market's periods of stress in 2014.  We want to find the key similarities and differences that were shown during each of the V-bottoms that occurred during the year.  To be clear, we're by no means suggesting that we expect the same scenarios to play out in 2015 but this exercise will serve as a learning tool and a way of documenting history.

2) Plainly put, it was a really crappy year for many investors.  While key benchmarks like the S&P and Nasdaq performed more than admirably, it was a much tougher go for individual stocks and most other asset classes.  This simple observation doesn't really tell us anything other than being on the lookout for future rotation and reversion to the mean types of scenarios.

Take some time this weekend to revisit the trading year.  You'll definitely find a useful observation or two.

A happy and healthy New Year to everyone.


Tuesday, December 30, 2014

New Year's Resolution - Managing Losing Positions

With only a few hours left in 2014, it's high time to start getting reflective and laying out plans for goals and improvement in 2015. No doubt we'll make a couple more poor decisions to close out the holidays (yes I need that 7th cookie and yes I'll have another bourbon) but once the calendar flips, it's time to tackle new challenges.  Tomorrow, Ryan and I will have our annual year-end lunch.  We'll review 2014, discuss what went right and what went wrong and then set our sights on 2015.  In looking ahead, we'll each come prepared with resolutions we hope to achieve in the new year.  They'll be wide-ranging.  Not only will we share our professional goals and what we'd like to achieve as a firm but also personal/lifestyle goals.  Since we're together on a daily basis, we're able to keep tabs on progress and hold one another accountable. 

I share this with you because we want to challenge fellow readers/investors/traders to assess their process in its entirety and be sure to acknowledge where improvements or new goals must be made.  This should be considered routine maintenance by any investor but all too many fail to be truly honest with themselves.  One area where we see many struggle is how to handle losing positions.  This is a primary determinant (if not THE PRIMARY factor) in one's long term success.  Loss management is so important for a variety of reasons but math and compounding sit at the top of that list.  Take a look at the chart below:


Percentage Loss
Percent Rise To Breakeven
             10%                     11%
             15%                     18%
             20%                     25%
             25%                     33%
             30%                     43%
             35%                     54%
             40%                     67%
             45%                     82%
             50%                    100%


Further, at a 70% loss you would need a 233% gain to get back to breakeven.  And not to be too obvious but once you run out of buying power/capital, you can't trade or invest at all. 

One should never allow a loss to grow so large that it makes recovery impossible.  It is imperative to have a line in the sand on every trade at which point you will take the loss and get out of dodge.  Some use tight stop losses while others are willing to allow for wider price swings.  Whatever your preference, a maximum loss tolerance should be a final component in establishing position size.

Being wrong is part of the process and, for most, it happens just as frequently if not more than being right.  The challenge is to achieve a profile where the average winning trade is larger than the average losing trade.  Having that ratio work in your favor over the long-term is a recipe for success.  However, staying wrong and not taking a loss at a certain point is a road to ruin.

Whats more, we have seen the toll large drawdowns can take on an individual.  It is physically and psychologically draining and can cause major emotional damage.  Traders and investors must avoid these pitfalls by having a disciplined risk management process. Preventing small losses from becoming big losses is easy in theory yet very difficult in application.  Finding the right balance in your risk management approach is imperative.

Take a moment as you prepare for a new trading year to make sure your risk management process is air-tight and fits your personality.


Monday, December 22, 2014

The Fed Stays Friendly


In its final policy statement of the year the Federal Reserve, through a bit of wordplay, appears to have provided just what stock market bulls had hoped for.  After falling almost 5% from its early December peak, the S&P 500 put in another swift v-bottom after digesting the Fed's latest statement and Janet Yellen's press conference that followed.

Bullish investors were hoping for language suggesting the Fed would continue to be their accommodative friend and they got just that.  The new buzzword was "patient."  As in, they "can be patient in beginning to normalize the stance of monetary policy."  Yellen further clarified the intention of staying patient by saying "this new language does not represent a change in our policy intentions."  That was all Wall St. needed to hear on Wednesday as the S&P went on to finish up more than 2% on the day and then did the same again on Thursday.  These were the first back-to-back 2% up moves for the S&P since early 2009.

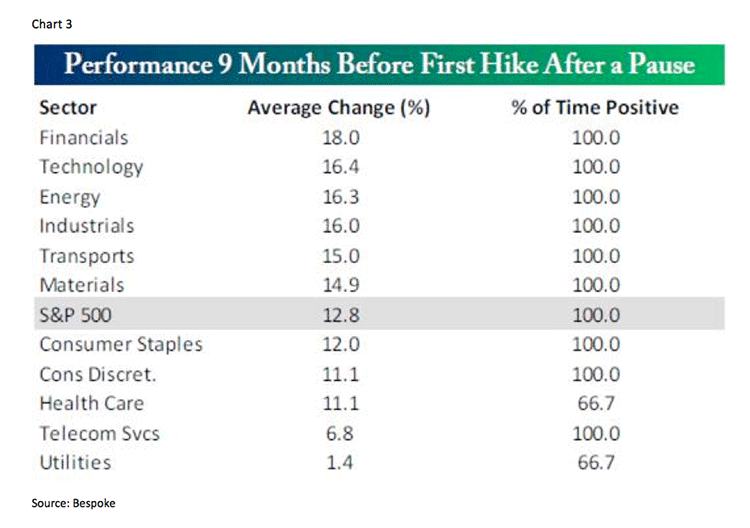
Coming out of the meeting it appears that Wall St. consensus continues to target June 2015 as the Fed's first rate hike announcement.  While we always hold a cautious eye toward the consensus view, we were reminded of a study Bespoke Invest ran back at the end of September.  They looked over the last 20 years to observe the performance of the S&P and its underlying sectors in the 9 months leading up to a rate hike.  If the June 2015 expectation is indeed accurate, this set of historical data suggests markets will continue to move higher over the next 6 months.

Note the broad participation.  Almost every sector is up significantly with Financials being the strongest.  Take a look...


Wednesday, December 17, 2014

Finding a Bottom (...Continued)

On Monday, we laid out a few bull and bear cases for potential market direction over the final weeks of the year.

As an update, yesterday we got the first signs of waning momentum in downside breadth.  Granted this is on a very short term basis but it was an initial hint that a short term exhaustion/bottom may be in place.  

That coupled with severe oversold conditions led us to believe that investors could see a tradeable short term bounce.  For instance, yesterday we observed a slowing of new 20 day lows across the market (we mentioned the significance of this in our Monday post).  We also saw fewer stocks moving down 4% or more on higher volume.  Again, couple that with extreme oversold indicators that we mentioned Monday and a rising VIX and the stage was set for an oversold bounce.  

The market started off the day strong and has now exploded higher after the Federal Reserve's scheduled 2pm comments.  A day does not make a trend change so we'll need price to continue to confirm and hold the lows.  That's what we'll be watching over the next several hours and days...

Monday, December 15, 2014

Finding A Bottom...

It appears that equity markets have finally succumbed to the ongoing selling in the oil/energy markets.  Prior to last week, the major stock indexes had been holding up quite nicely in the face of the energy meltdown but no longer.  The S&P 500 is down more than 4% since last Monday and the Russell 2000 is back into negative territory for the year. There are only 11 trading days left in the year but for some reason we don't think they'll pass by quietly.

As we looked at our data and indicators over the weekend and today, we took a quick tally of various Pros and Cons currently working for and against the market.

Pros (Market will rebound and finish out the year strong):
  • Potential V-shaped bottom:  This has been the common theme over the last 2.5 years. Anytime the market has weakened and undergone a "significant" pullback it has put in a sharp V-bottom and quickly recovered to new highs. 
  • Seasonality on bulls side:  We've entered the thick of "Santa Rally" season and this will only get stronger as the year closes out.
  • Logical support around 50-day MA on S&P, Nasdaq, Russell 2000:  Each of these indexes are around or approaching this significant level of support.
  • We've started to observe some really dependable oversold indicators:
    • The 4, 13, and 52-week New Highs/New Lows Ratios are at oversold levels.
    • The NYSE McClellan Oscillator has officially moved into oversold territory after today.
    • The % of stocks on the NYSE above their 200-day is now at oversold levels. Since 2012 this indicator has only gone below the 40% level 3 other times (6/12, 11/12, 10/14).  All 3 ended up being very solid buying opportunities. 
Cons (Market continues to weaken into year-end)
  • Bear market in energy: No explanation needed.
  • Expansion of Breadth to downside  - We're seeing an expansion of new 20-day lows across the market. 
  • The potential impact of tax-loss selling into year-end.  
  • Momentum names are starting to break down with the red hot bio-techs (IBB) starting to wilt. 
The holiday season has us wanting to lean optimistic.  We say keep an eye out for the first signs of divergence in breadth and price.  We'll be looking for fewer individual stocks making new lows and then a reversal to the upside in the indexes.  That could be the market putting in the next bottom.

-Ryan Worch


Friday, December 12, 2014

Predictions & Sentiment

expand large image


That was the cover of last Saturday's Barron's.  The featured article included the following:

"We’re not saying the stock market will never suffer serious declines. It always has and always will. That’s the way capitalism works....Maybe the next crash will be caused by unrest in the Middle East, an Ebola pandemic, further slowing in China’s economy, some unforeseen fallout from the collapse in oil prices, or a bellicose maneuver by Russia’s Vladimir Putin. But right now, to us at least, it doesn’t look like Internet stocks will be the culprit."  
While the cover is indeed jarring at first sight, the actual story lays out a compelling analysis of the fundamental differences between today's market and the euphoria filled days leading up to the Dot Com bubble bursting.

When it comes to stock market predictions, magazine and newspaper covers have served as an amazing contrary indicator over the years.  Some outlets have been consistently and embarrassingly wrong with the timing of their predictions.  We had a laugh in the office yesterday as we compared their terrible records to two of our close friends with historically bad sports betting resumes.  We eventually had them team up to form the "Mush Brothers" with the premise being to bet the exact opposite of their weekly game picks (for entertainment purposes only of course!).  The results were both hilarious and wildly profitable for those that faded their ideas.

So while we usually cringe when we see comments like "this time it's different" or something similar, Barron's did a proper job of acknowledging that, as sure as the sun rises, the market will eventually face a period of extreme stress and drawdown.  That's simply a given.  We just don't know the cause of it yet.  Could it be the ongoing crash in oil? Possibly.  There are a ton of variables at play here and the market finally appears to be appreciating them.  The whippy stock market action of the last 3 days proves as much.

Looking at real-time data, investors do not appear to be concerned about a potential fall in stocks.   According to the weekly survey from the American Association of Individual Investors (AAII), bullish sentiment increased from 42.68% up to 45.02%.    According to Bespoke, this is the 10th straight week that bullish sentiment has been above its bull market average of 38.3%, which is the longest streak since early 2013.


We would anticipate investors remaining in a cheery mood through year-end as history suggests the "Santa" rally should kick into full gear next week.  Here's a look at S&P performance during the last 2 weeks of the year since 1990.  The results have a decidedly bullish bias.  (Chart created by market technician Chad Gassaway).


Let's see what happens...

Wednesday, December 10, 2014

Revisiting Divergences

In our September 24th post, we offered the following commentary and accompanying chart as we looked at the divergences taking place between small cap stocks and large caps:

However, what worries us is the clear divergence between small caps and large caps.  The folks at Nautilus Research (@NautilusCap) help sum this up with the data shown below.  It looks at the instances where the S&P has proceeded to climb (up > 5% in a 6 month period) while the Russell is retreating on a relative basis (RTY/SPX Declines > 10% over the same 6 month period).  To summarize, the data portends to the Russell and the S&P struggling over the next couple of months and considerably underperforming relative to their historical trajectories.


Embedded image permalink

So we're almost at the 3 month mark of the most recent iteration of this specific RTY/SPX divergence and while each index is up a fair amount since that point (SPY +1.6%, RTY +3.2%), we've seen some pretty dramatic volatility in each.  Almost on cue, the S&P followed the Russell on its descent before each bottomed out in mid-October. Quickly thereafter, the S&P shot to new highs and the Russell recaptured positive territory for the year.  However, each has traded in a sideways chop over the last month and volatility perked back up this week with oil plunging.  So now what?  We're not sure and hence why we revisit this study.  For all of the favorable seasonality and sentiment measures we have going into year-end it's nice to have some contrasting data (albeit small sample size) to keep the good vibes in check.  Looking out to the 6 month marker, expected/average returns in this scenario continue to look fairly uninspiring.

Speaking of the Russell 2K, we're scratching our head at its recent underperformance.   With the strength in the US dollar one would think this would favor small cap companies with a more domestic focus vs large cap multinationals.  We thought this might be enough to break the divergence.  However, the exact opposite has happened and money has continued to rotate out of small caps and into larger cap names.  Perhaps after last year's surge in small caps the relative weakness this year could be wringing out the excesses.  Will money continue to flow to safer larger cap companies with stronger balance sheets or will smaller cap higher growth companies reverse their current weakness and start to exert some leadership?  Only time will tell.


Sunday, December 7, 2014

YTD Strength and Weakness

At any point in the year it's important to understand where money has rotated and which sectors are most responsible for the direction of the broader market.  The month of December brings about additional factors that may influence money rotation and the behavior of the year's leaders and laggards.

As it stands, the S&P 500 is up north of 12% in 2014.  Sectors most responsible for the index's rise include Health Care (XLV up 27% ytd), Utilities (XLU up 22%) and Technology (XLK up 18%).  Consumer Staples, Financials and Industrials have stayed relatively in line with the index while Homebuilders (XHB down .5%), Energy (XLE down 8%) and Metals/Mining (XME down 23%) have been extreme laggards.

Looking globally, Indian stocks have dramatically outperformed most investable markets this year (INDY up 35%).  Other notable markets include China (FXI up 8%), EWH (up 3%), Japan (EWJ down 3%), Germany (EWG down 10%) and Brazil (EWZ down 12%).

What we typically see over the last month of the year, particularly in an advancing market, is that leaders stay strong while losers will continue to slide into year end.  A primary reason the weak sectors and individual stocks continue their downtrend is tax-loss harvesting. Investors look to sell losing positions in an effort to offset any gains they've realized over the course of the year.

If you're looking to put cash to work or re-allocate your portfolio going into year-end, you'll want to know where the dollars are flowing and what areas of the market are showing signs of weakness.


Friday, December 5, 2014

Remaining Patient in a Challenging Market

The recent market choppiness has us uttering certain words over and over around the office.  While some aren't fit for print, one that stands out is patience.

Here's why:

Stock market gains in 2014 have been made on narrowing leadership.  While the major indices like the S&P and Nasdaq continue to set new all-time highs, a different story is being told when we look at stocks individually.  For instance, the Nasdaq is up 14% on the year however much of those gains can be attributed to the index's largest components. Apple makes up more than 9% of the index and its share price has risen 47% YTD.  Microsoft, the next largest weighting at 6%, is up 32%. Other heavily weighted stocks like Intel, Facebook, Gilead and Amgen are all up significantly more than the overall index.

This sparks a number of observations.  First, yes, there remain opportunities to capitalize upon individual names.  However, the abundance of those names has dwindled as the year has worn on. Many of the stocks in the Nasdaq remain well below their early 2014 highs.  Looked at individually, the average stock in the index is up less than 3% on the year.  This means that bigger cap names, like the companies mentioned above, have pulled a considerable amount of weight in order to drag the index higher over the last several months.  That's perfectly OK for shorter periods of time but if things remain narrow over the longer term the chances of the index collapsing under its own weight likely increases.

Further, breadth measurements on the Nasdaq, as well as the S&P and Russell 2k, are all showing signs of exhaustion as the % of stocks above 10 and 20 day moving averages are all making lower highs as price continues to make higher highs.  Couple that with the longer term A/D Lines on both the S&P 500 and Nasdaq, we can see this is a market making progress on less and less participation and momentum.  Again, these are secondary indicators but they are waving the caution flag nonetheless. (Yellow is A/D Line, Blue is Index).


More data?  On Monday, we observed that the number of stocks making a 4% or greater move lower on higher volume was the second biggest reading all year.  *Note* we caveat the higher volume reading because of the holiday shortened session on the Friday before.  We didn't put much stock in that figure but coupled with other data we track, our risk meters started to perk up.  The number of stocks making new 20 day lows across all listed equities was in the top decile for all of 2014.  Also, the declining volume on the Nasdaq was 83% of total volume.  These aren't necessarily extreme readings but certainly high enough to turn our heads.

Observations like these suggest this bull market is showing signs of fatigue and may be in need of a rest.  However, it does not mean that the market will correct in short order.  It very well could just consolidate before resuming its plod higher.  That brings us to the point of this entry: PATIENCE. Six years into this bull market, we know better than to be calling tops. However, we will readily admit that this has not been an easy year for active management and stock picking.  Environments like this serve as important reminders for investors/traders to acknowledge that their system and edge will not align with every market.  For "Buy and Hold" market participants this is likely nothing more than noise but for active investors it's a call for heightened awareness.  Having the ability to appreciate that fact is critical to long term success.  What do we do when the market is not giving us the risk/reward scenarios we prefer?  Well, we like to raise lots of cash, sit on our hands and do even more research. Really boring stuff but also the best course of action.  What we don't do is over-trade, violate our rules or lose sight of the larger goal.

If you find yourself falling victim to impatience when your strategy is not in tune with the market, you must address this ASAP.  It's every bit as important, and then some, as uncovering your next great trade idea.

For further commentary, one of our favorite resources, Dr. Brett Steenbarger, touched on similar topics yesterday over at his site.

-Ryan Worch


Thursday, December 4, 2014

We're Back!

After a brief hiatus, the Worch Capital blog is back and fully operational.  We had to freeze all social media activities as we worked through some operational updates and transitions here in the office.

It is our intention to be a consistent presence in the financial blogosphere moving forward. As mentioned in our very first post, we plan to touch on a wide variety of topics and hopefully spark some productive thought and conversation.

We look forward to interacting with you again.  Let's have a great end to 2014 and an even better 2015!

Look for our first post sometime tomorrow!