Showing posts with label Relative Strength. Show all posts

Wednesday, September 23, 2026

The Coiled Spring: Why Tape Action Trumps Headlines


If you relied on financial news networks to manage risk over the past month, you would have been completely flat or aggressively short.

The media narrative engine offered a relentless steady stream of doom:

  • "10-Year Treasury Yields testing multi-decade highs at 5.00%!"

  • "WTI Crude surging toward $100+ on Middle East supply shocks!"

  • "Geopolitical tensions escalating across Europe and Asia!"

Yet, while commentators debated the macro end-times, the tape was quietly whispering a radically different truth.

After almost four months of choppy, range-bound consolidation, the Nasdaq staged a massive multi-week breakout on September 21, vaulting over 2.2% in a single session to set new all-time record highs alongside a 1.5% rip in the S&P 500 up to 7,764.

When a market refuses to roll over in the face of universally hostile news, it isn't an anomaly, it is the single most powerful technical signal an institutional growth manager can observe.

1. The Mechanics of the Coiled Spring

Why is price action under headline stress so revealing? Because the order book is where institutional capital votes with real money, not opinions.

For months, the bears had every macro weapon imaginable: elevated borrowing costs, energy inflation, and geopolitical risk. Yet, every single time the indices pulled back to key structural support, like the S&P 500 testing its June pivot, institutional buyers stepped in and quietly absorbed the supply.

This price behavior is the equivalent of a beach ball being held underwater:

  • Accumulation Under Pressure: While retail traders panic-sell headlines, institutions use the liquidity of bad news to build large positions in top-tier growth names.

  • Sellers Get Exhausted: When a market stops going down on bad news, it means everyone who wanted to sell has already sold.

  • The Breakout Trigger: The moment macro pressure eases even slightly, whether it’s a minor pullback in crude or a pause in yields, that compressed spring releases. The result is a violent, vertical breakout that leaves the sideline crowd stranded in cash.

2. Strong Earnings: The Hidden Fundamental Engine

The tape doesn't act like a coiled spring without a fundamental engine. Beneath the geopolitical noise, corporate earnings, particularly across semiconductor powerhouses, AI infrastructure, and enterprise software, have remained rock solid.

Institutions aren't buying hope; they are positioning ahead of structural Q3 and Q4 earnings acceleration. They understand that if the market can hold record highs with 5% yields and $95+ oil, any eventual cooling in inflation or diplomatic relief in geopolitical hotspots won't just keep the market steady, it will unleash a massive wave of capital deployment.

3. The Execution Playbook: How to Trade the Breakout

A textbook coiled-spring breakout requires a sharp pivot in execution. You go from the "defense-first" stance of late August to disciplined offensive scaling:

  • Trust the Relative Strength Leaders: Pay closest attention to the stocks that broke out first: the AI hardware, semiconductor, and software leaders that refused to break their 21-day or 50-day moving averages during the August/September chop. They will lead the next leg of the bull run.

  • Transition from Pilot to Core Sizing: The period for sitting on 2.5%–5% pilot positions is passing. As setups confirm on heavy volume, systematically scale your high-conviction winners into full 8%–10% core positions.

  • Use the Breakout Shelf as Your Line in the Sand: The previous resistance level on the Nasdaq and S&P 500 now becomes your primary support floor. As long as the indices hold above their September 21 breakout shelves, the structural trend is decisively higher.

The Bottom Line

Pundits predict; the tape confirms. When the market absorbs a wall of macro worry and breaks out to new highs anyway, stop arguing with the headlines. Respect the price action, trust the coiled spring, and allocate capital to the market leaders driving the next leg of this trend.

Wednesday, June 17, 2026

Catching the Knife Safely: The Rules of the Pullback Buy


One of the oldest adages in growth investing is to "buy the pullback." In a strong bull market, buying elite names when they take a breath offers an entry point with a much tighter risk-to-reward ratio than chasing a vertical breakout.

But anyone who has traded a high-beta tape knows the terrifying reality: today’s orderly pullback can easily become tomorrow’s elevator shaft. Distinguishing between a routine pause in a structural uptrend and the first leg of a major institutional distribution campaign is the ultimate test of a fund manager's discipline.

At Worch Capital, we don't guess. We rely on a strict, technical framework to determine when to step into the bid, and exactly why pullback buys require entirely different position-sizing rules than structural breakouts.

The Three Signals of a Structurally Sound Pullback

When high-flying leaders pull back, we are not looking for "cheap" prices; we are looking for the footprint of institutional support. A healthy pullback should exhibit three distinct technical characteristics:

  • Decreasing Volume on the Down Days: This is the most crucial variable. A normal pullback is caused by a temporary lack of buyers, not an influx of aggressive sellers. If a stock drops 5% on volume that is 40% below its 50-day average, it indicates the big money is simply stepping aside, not dumping shares.

  • Clustering at Structural Moving Averages: Elite momentum names should defend their short-term structural baselines. We look for a constructive "touch and go" or a brief shakeout that immediately recovers at the 10-day exponential moving average (EMA) or the rising 21-day EMA.

  • Prior Breakout Resistance Acting as Support: We check the previous major base. A healthy stock will often map out a "return to the scene of the crime," pulling back to test the exact horizontal price line it previously broke out from. If old resistance turns into new support on low volume, the tape is structurally sound.

Pullback vs. Deeper Correction: The Fork in the Road

How do you know if a dip is a routine buy or the beginning of a deeper 20-30% market correction? The truth is, you don't know immediately. The market is an unfolding movie, not a still photograph. However, the tape gives clues through its character:

Technical VariableHealthy Bull Market PullbackBeginning of a Deeper Correction
Index BehaviorIndex holds its rising 21-day EMA.Index violates 21-day EMA on heavy volume.
Leadership ActionLeaders pull back orderly while others break out.Market leaders experience "gaps down" on massive volume.
Market BreadthThe percentage of stocks above 50-DMAs stays stable.Internal distribution accelerates across all sectors.

The Execution: Why Pullbacks Demand Smaller Sizing

Because you cannot predict with 100% certainty whether a pullback will hold or fail, your risk management rules must adapt. This is why our playbook dictates a vital rule: We play smaller on pullback buys than we do on breakout buys.

When you buy a stock clearing a fresh, tight consolidation on a volume expansion (a breakout), the market is giving you immediate validation that demand is exceeding supply right now. The trend is actively accelerating.

When you buy a stock on a pullback, you are fundamentally catching a declining asset. You are buying anticipation, not confirmation. Because you are stepping in front of downward momentum, the risk of an "air pocket" is inherently higher.

  • The Pilot Position Strategy: Instead of scaling in with a full 10% portfolio position, we initiate pullback buys using small 2.5% to 5% pilot positions.

  • The Stop-Loss Anchor: We keep our stops incredibly tight, often just below the intraday low of the support test. If the support level snaps, we take a minor scratch on a small position. If the pullback holds and the stock begins to turn back up, we can always add to the position on a breakout of the new, shorter-term downtrend line.

The Bottom Line

Pullback buying is an invaluable tool for building an equity curve, but it must be executed with extreme humility. By looking for low-volume support tests, utilizing strict trailing stops, and scaling down our initial position sizes, we ensure that we stay nimble enough to capture the market's gifts without getting crushed when the structural rubber band finally decides to snap.

Wednesday, April 15, 2026

Decoding the Nasdaq Bounce: Separation, Not Correlation


The recent rally off the lows has been a masterclass in market character. For the undisciplined trader, a green Nasdaq screen looks like a blanket invitation to buy everything. But for those of us running a long-short growth strategy, the tape is telling a much more nuanced story. This isn't a "rising tide lifts all boats" scenario; it is a period of intense separation.

Understanding what is working and more importantly, what isn't, is the key to determining if this is a sustainable regime shift or simply a tactical bounce in a broader correction.

What is Working: The "New Leadership"

The names leading this charge are not the laggards of 2025. We are seeing institutional money flow into two specific buckets:

  1. High-Relative Strength (RS) Growth: We are watching stocks that barely corrected 10% while the Nasdaq was down 15%. These names held their 50-day moving averages and are now hitting all-time highs while the index is still struggling with overhead supply.

  2. The "Earnings Winners": The market is rewarding growth. Companies that reported "beat and raise" quarters are being "bought on the gap," showing that big money is willing to pay up for certainty in an uncertain macro environment.

The "Market Score" Reality Check

At Worch Capital, our Market Score model is currently flashing a green light. Price action is improving along with market breadth. However it remains narrow as this suggests that a few names and themes are doing the heavy lifting while the median growth stock remains in a choppy range.

The Strategy: Measured Aggression

We aren't chasing the index. We are looking for the names that showed the most resilience during the lows.

  • Pilot Positions: We are entry-testing with small sizes to see if the market gives us that "instant feedback" of profit.

  • The Stop-Loss Anchor: We maintain our strict 1% total equity risk. If a "leader" fails to hold its breakout level, we exit immediately. The Nasdaq rally means nothing if your individual holdings aren't trending.

The Bottom Line

This rally is a "show me" move. The market is proving who the new leaders are, and more importantly, who the bag-holders will be. We stay focused on the stocks that are "outperforming on the way up" and "ignoring the way down."

Friday, January 7, 2022

What's in store for 2022

As we embark on 2022 many market pundits are putting out their yearly predictions. We always find these more entertainment and theater rather than actual advice because the honest truth is, no one has any clue what the future holds and the market doesn't care about my opinion. Frankly there are always issues to worry about: Omicron shutdowns, new variant, supply chain glitches, labor shortage, school closures, higher inflation, rate increase cycle, Mid term elections, military conflict, etc. Our investment philosophy isn't predicated on predicting the future but rather reacting to current data. We use current and past data to help shape a thesis for potential outcomes in a scenario analysis manner. Then when events and conditions change we adjust our positioning and risk accordingly. The old adage sums it up perfectly, "the only constant in life is change".

With that said, to look out to next year we need to first assess what has actually taken place in real time. 2021 provided great returns across the asset class spectrum for everything except gold and treasuries. Jurrien Timmer from Fidelity sums this up in his table of investment returns.

Even as the general market provided health returns there was plenty of churn under the surface. Remarkably, the average Nasdaq drawdown from YTD highs is a whopping -42%.

Cathie Wood has taken a lot of heat this year as her Ark funds have under performed. But a simple ratio chart of the ARKK ETF to the SPY shows how dramatic the selling has been in high valuation growth names. ARKK peaked in February and has drastically under performed the S&P since then. Currently it is more than 50% of it's YTD high. 


Most of the destruction in high beta growth can be attributed to the pivot from the Federal Reserve to speed up the tapering process to fight inflation they let get out of control. A tweet from Puru Saxena highlights how expensive stocks have lagged all year when plotted against the Fed's balance sheet.


This begs a bigger question. What is the impact from QE on the markets. Clearly quantitative easing has been a tailwind to the S&P. However, the reversal of QE (tapering) that reduces liquidity in the economy seems to be a headwind. The following two charts from William O'Neil touch on this.

On top of that the Fed's actions have historically triggered greater volatility. 


The following two charts increase the likelihood for the potential for a more volatile environment next year. Low volatile years like 2021 are historically followed by more volatility.


The presidential cycle doesn't do any favors either. The first three quarters are weaker than normal heading into the mid term elections.


One of the biggest market concerns is the rate of inflation and the pace of interest rate hikes from the Fed. However, should we be scared of rate hikes? Bespoke has great data on this. What I found most interesting was, "as shown, the broad market tends to do poorly in the first three month of a tightening cycles over recent year, bu longer-term that's a buying opportunity as forward returns average 7.1% (86% positive) over the first six months follow a rate hike."

Ken Fisher validates this theory that the market shouldn't be spooked by rate hike cycles. Outside of the mid 70's stagflation, equity returns have been positive during rate hike cycles.


Some more data points in the bull case shows how strength begets strength. One of our favorites Ryan Detrick shows what happens after big up years in the S&P 500. The average return next year is 11.6%.


Another interesting stat lies in the fact that 2021 was a unique year. It was only the 5th time in history going back to the 1920's that the S&P finished up double digits three years in a row. We looked at what happened the 4th year after three straight double digit years. The returns surprised us.

Year Yearly Return
1942 12.43%
1943 19.45%
1944 13.80%
1945 30.72%
1949 10.46%
1950 21.56%
1951 16.46%
1952 11.78%
1995 34.11%
1996 20.26%
1997 31.01%
1998 26.67%
2012 13.41%
2013 29.60%
2014 11.39%
2015 -0.73%
2019 28.88%
2020 16.26%
2021 26.89%
2022 ?
Average 4th Yr Returns 17.11%


In conclusion, the data points to a mixed bag and has something for everyone. The bears can highlight tapering and volatility while the bulls can point to continued momentum. Our best guess is the first half will be more volatile than normal with multiple pullbacks. But as the supply chain gets worked out after Omicron dies down that should help inflation ease. Tapering should be done by the first quarter and we should have the first rate hike behind us sometime in the first half. That could set the stage for a second half rally as pent up demand comes on board and a strong finish once the Midterms are behind us. As I said in the beginning, the market doesn't care about my opinion. That is why we prefer to see how the tape reacts to new information and we'll adjust accordingly. 

Happy New Year!

Friday, March 1, 2019

A look to March and beyond

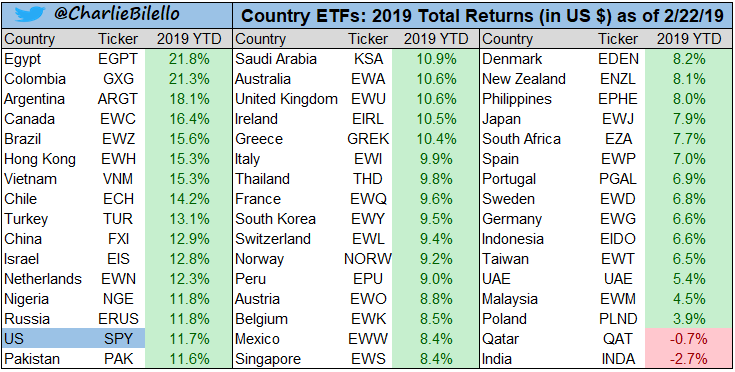
The global markets have started off 2019 on a blistering start with the average return of +10%. According to Charlie Bilello, global equities are off to their best start to a year since 1987: 46 out of 48 country ETFs positive w/ an average return of +10%.  Domestic markets have been extremely strong after a tough 2018 with small caps and tech weighted indices leading the charge.  We have gone from a risk off 3-month bear market to a V-shaped risk on environment.  The Russell 2k fell 12 out 16 weeks while the NDX fell 9 out of 12 weeks from their fall peaks.  Since their December trough, both the RUT and NDX have rallied 9 weeks in a row.  Can they extend the streak to 10 weeks?  During the same stretch the VIX has gone from over 35 to below 15.  Needless to say, its been a volatile 6 months since the September 2018 highs.  How does the current strength position us for the rest of the year?


The statistical analysis sets up very favorably for sizable gains the rest of the year based on the current strength YTD.  Below are various studies that validate strength begets strength.  As much as we use data and statistical analysis to shape our bias and views we have to remember that the predictive nature of data is just one tool that we use to guide our thesis.  Last year was a great example of how useless this data can be and a good reason why we don't follow it blindly.

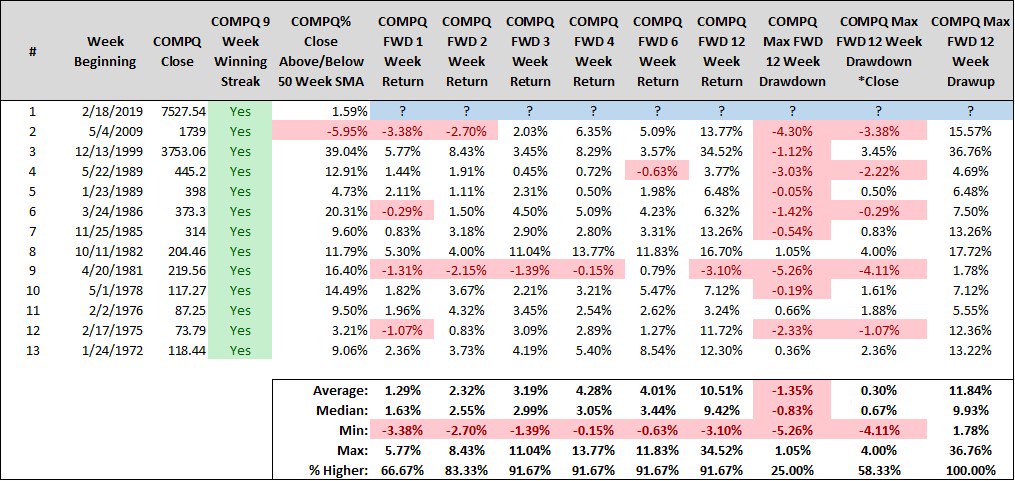
Steve Deppe has a nice table showing what happens after the Nasdaq has gained 9 weeks in a row.  If returns 3 months from now meet the historical average (10.5%), Nasdaq will be well above its September all time high. 


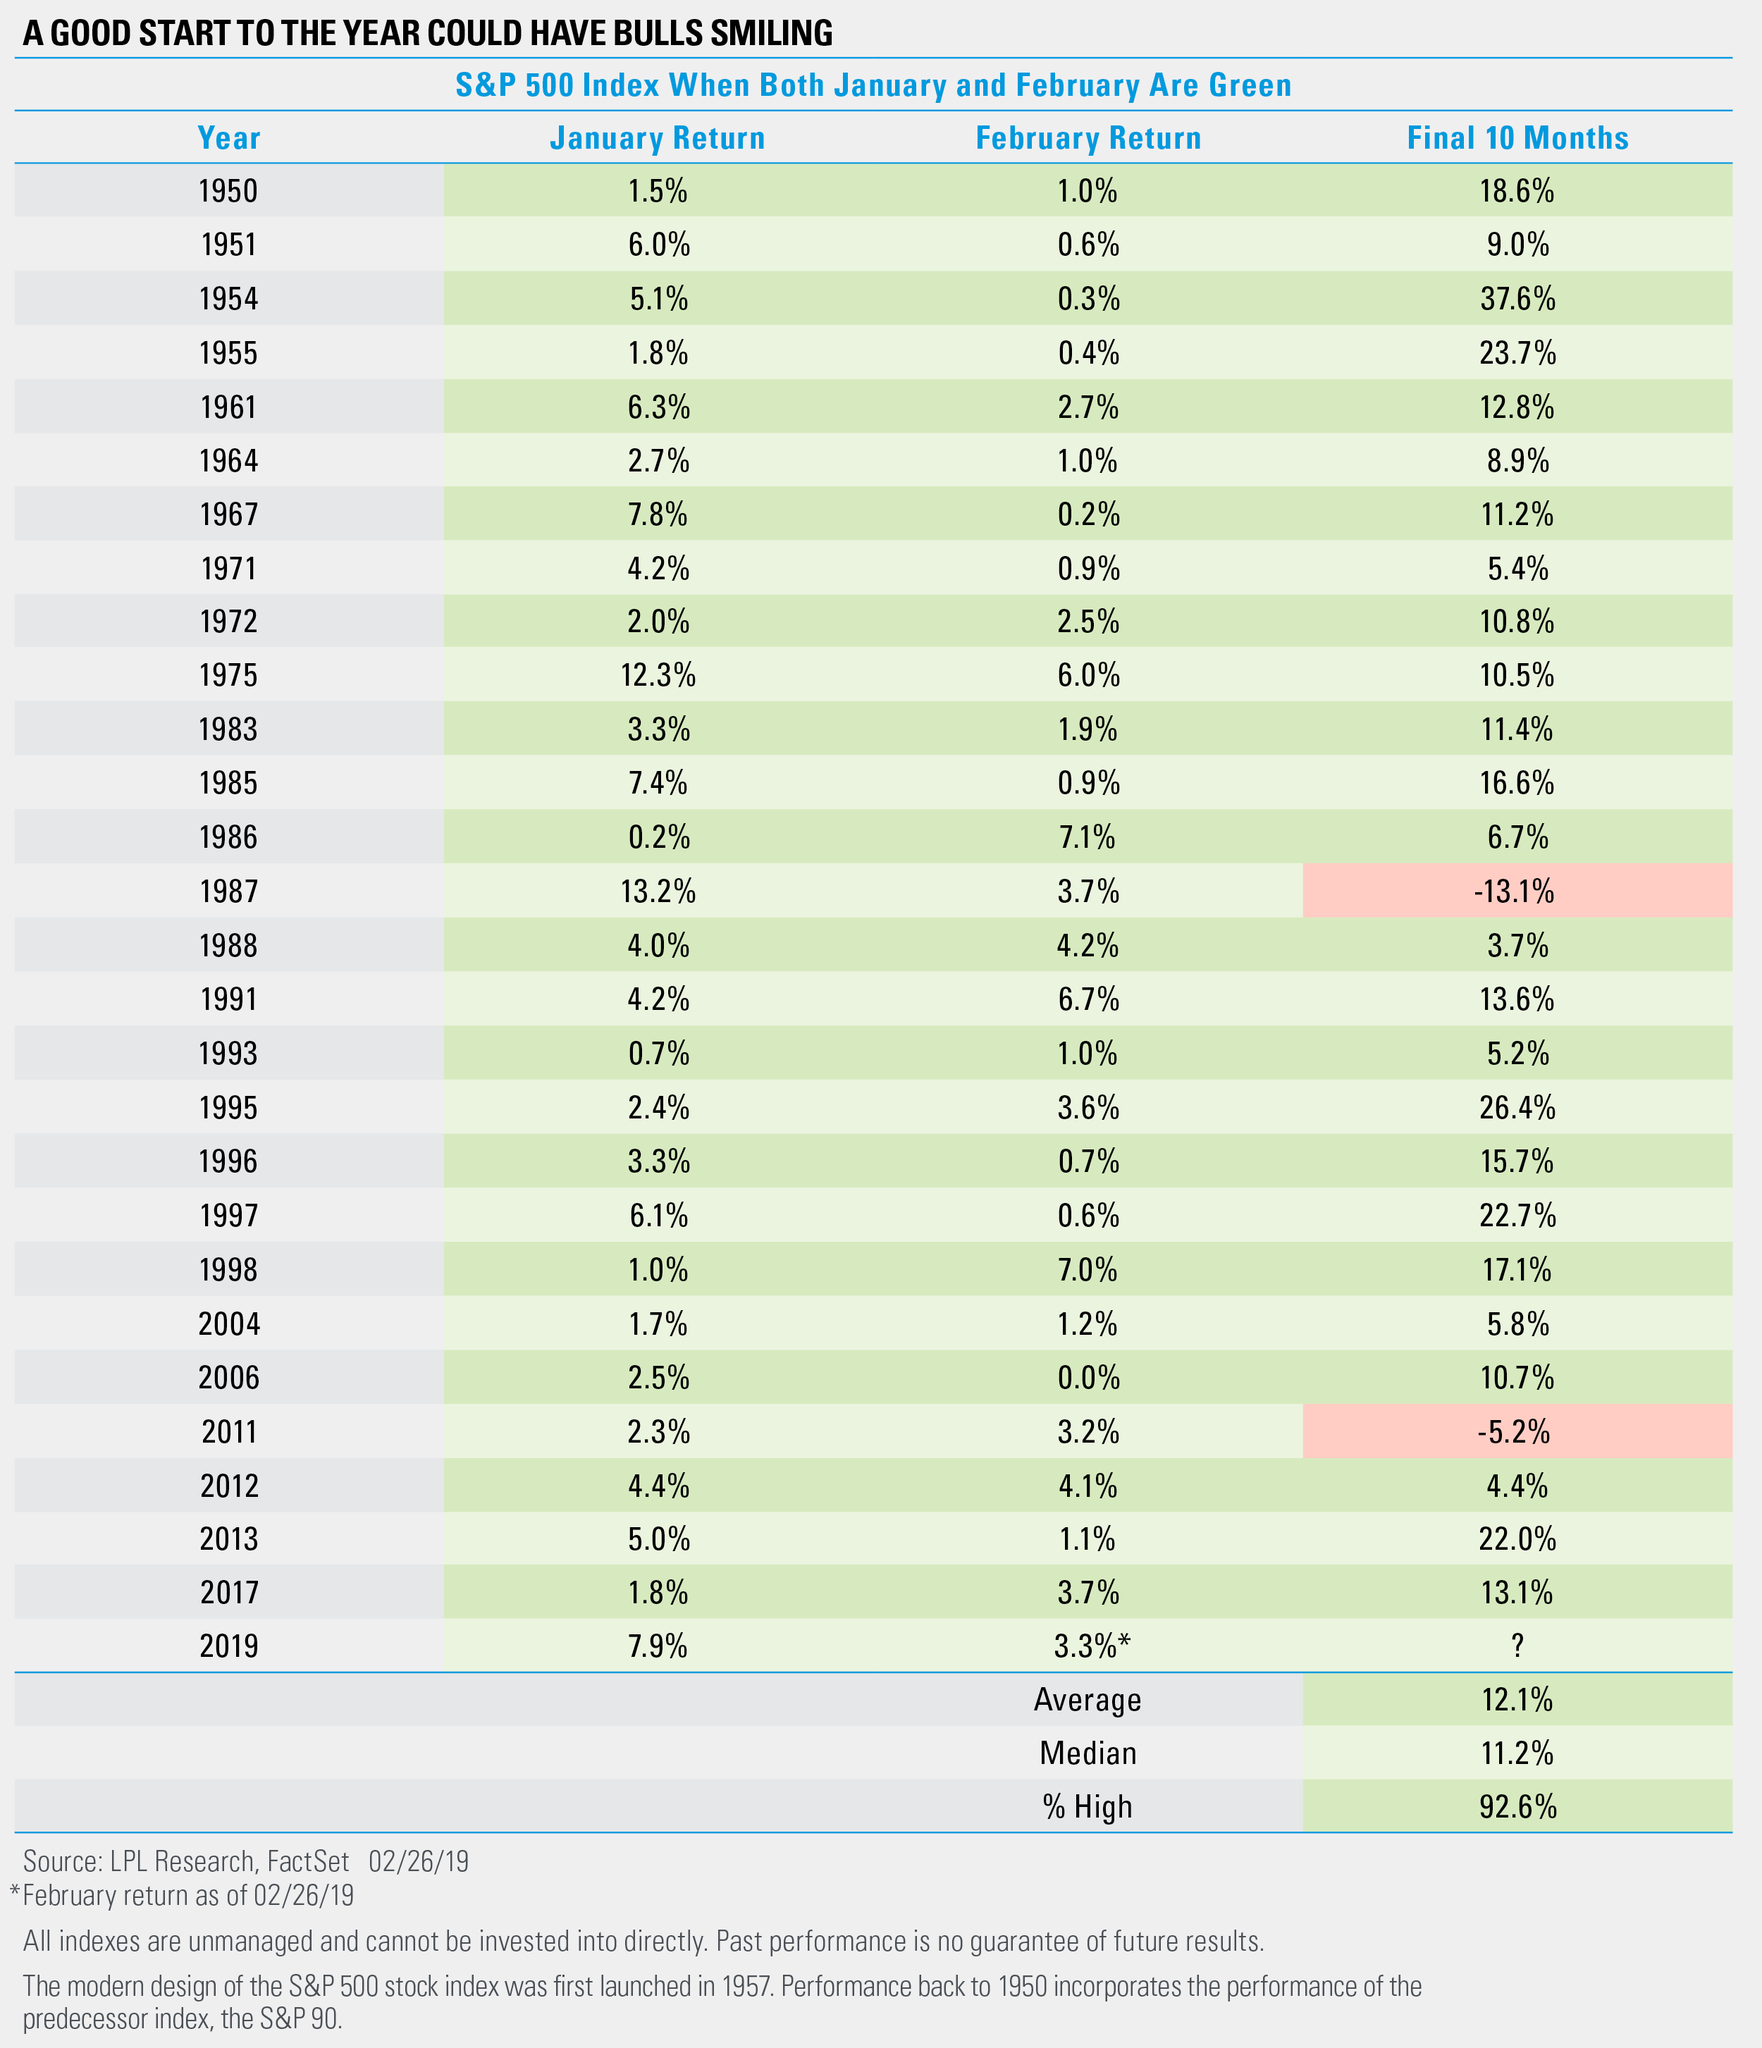
A post from Ryan Detrick shows the past 27 times the S&P 500 was higher in both January and February saw the final 10 months gain 25 times. Additionally, the avg return is 12.1% versus an avg final 10 mos of 7.6.


According to Nautilus Capital when the S&P is up 7.5% or more through February, gains continue to be promising going forward. 


An interesting stat from Bespoke speaks to the strength of the winning streak to start the year.


Are you tired of winning yet? Based on the S&P 500's start to 2019, the odds are that if you aren't tired of winning now, you will never be.  With the S&P 500 on pace for its 27th up day in the 37 trading days so far this year, 2019 is on a record pace for the frequency of positive days to start a year. Throughout the history of the S&P, there has never been a year that saw so many positive days in the first 37 days of trading (73%), and there have only been seven other years where the percentage of positive days even topped two-thirds at this point in the year. For reference, in an 'average' year it typically takes until March 16th before the S&P 500 has its 27th positive close of the year,and the longest it ever took for the S&P to reach its 27th positive close of the year was in 1932 when the 27th up day wasn't until April 21st.

The morning track from Raymond James chief strategist Jeff Saut had some good commentary from Leoy Tuey.  "Word of wisdom from Leon Tuey as many brokers continue to look for a test of the low.  While short-term overbought, a pause is all the bears can expect, but no major setback because:

1. In December, investors panicked and sold down to "sleep level" and beyond. Consequently, they are grossly under-invested inequities and are sitting on record cash.
2. While short-term optimism has risen, sentiment backdrop remains one of fear, not pessimism, but fear.
3. More importantly is global easing. Because of global slowing, the EU, Japan, and the U.S. are becoming more dovish. As mentioned in my reports, last year, Jerome Powell, the Fed Chairman, made a profound announcement that few paid attention: "We would like to smooth out the wild swings in past economic cycles by fine-tuning the monetary policy." If successful, the US and the world will see a period of unparalleled prosperity as history shows that the best environment for equities is in a period of modest growth and stable inflation, not too hot, not too cold, the so-called Goldilocks economy.
4. The record highs set by the Advance-Decline Lines speaks to the strength and power of this bull market. Will they test the lows, not bloody likely!"


Breadth has confirmed and added to the bullish theme to start the year.  An expansion of new 52-week highs along with the % of stocks trading above their 50 and 200 day moving averages continues to increase. 


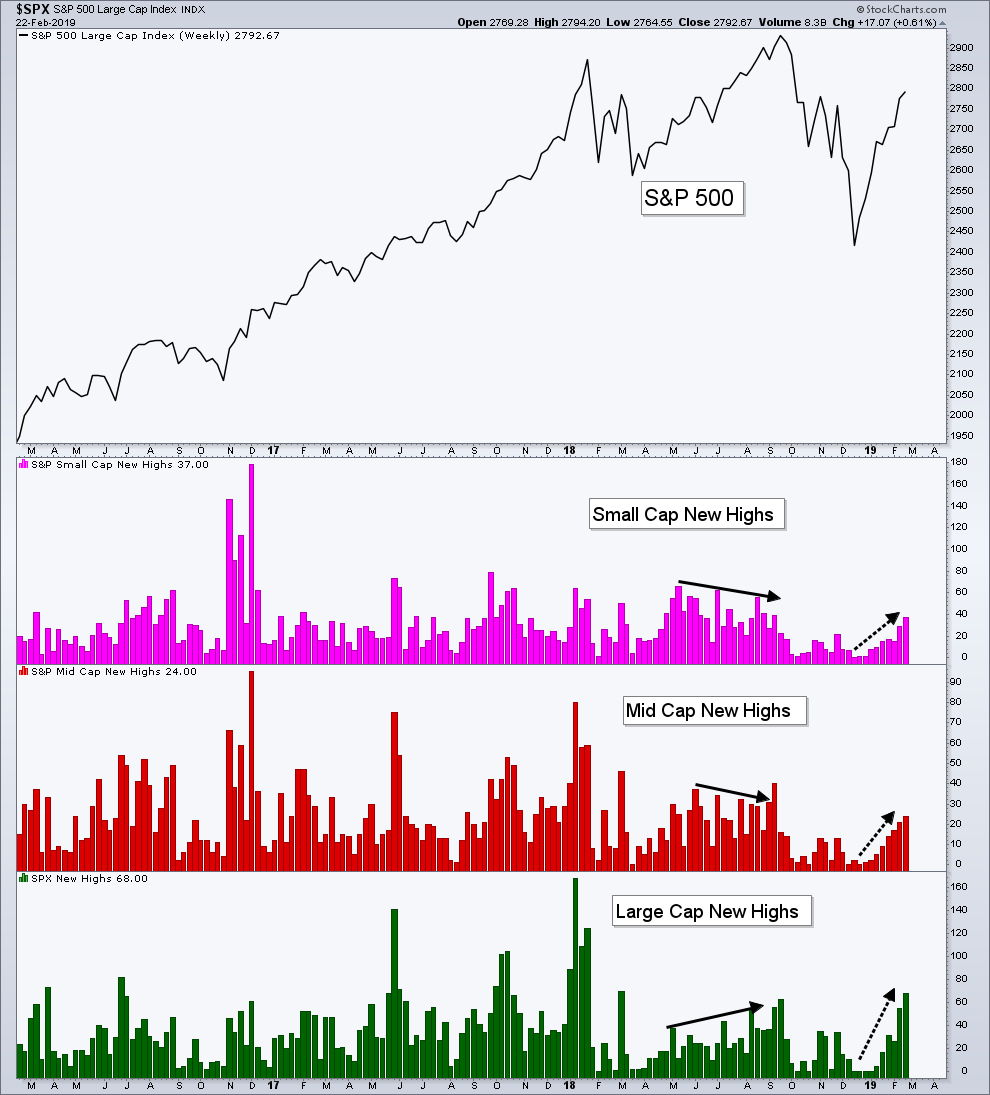
While I remain concerned about the volatility landscape, it is encouraging to see new 52-week highs continue to increase across small-, mid-, & large-caps - a luxury we didn't enjoy going into the September high.


The % of stocks trading about their 50 day moving average is higher then the Jan and Sept 2018 peaks. 


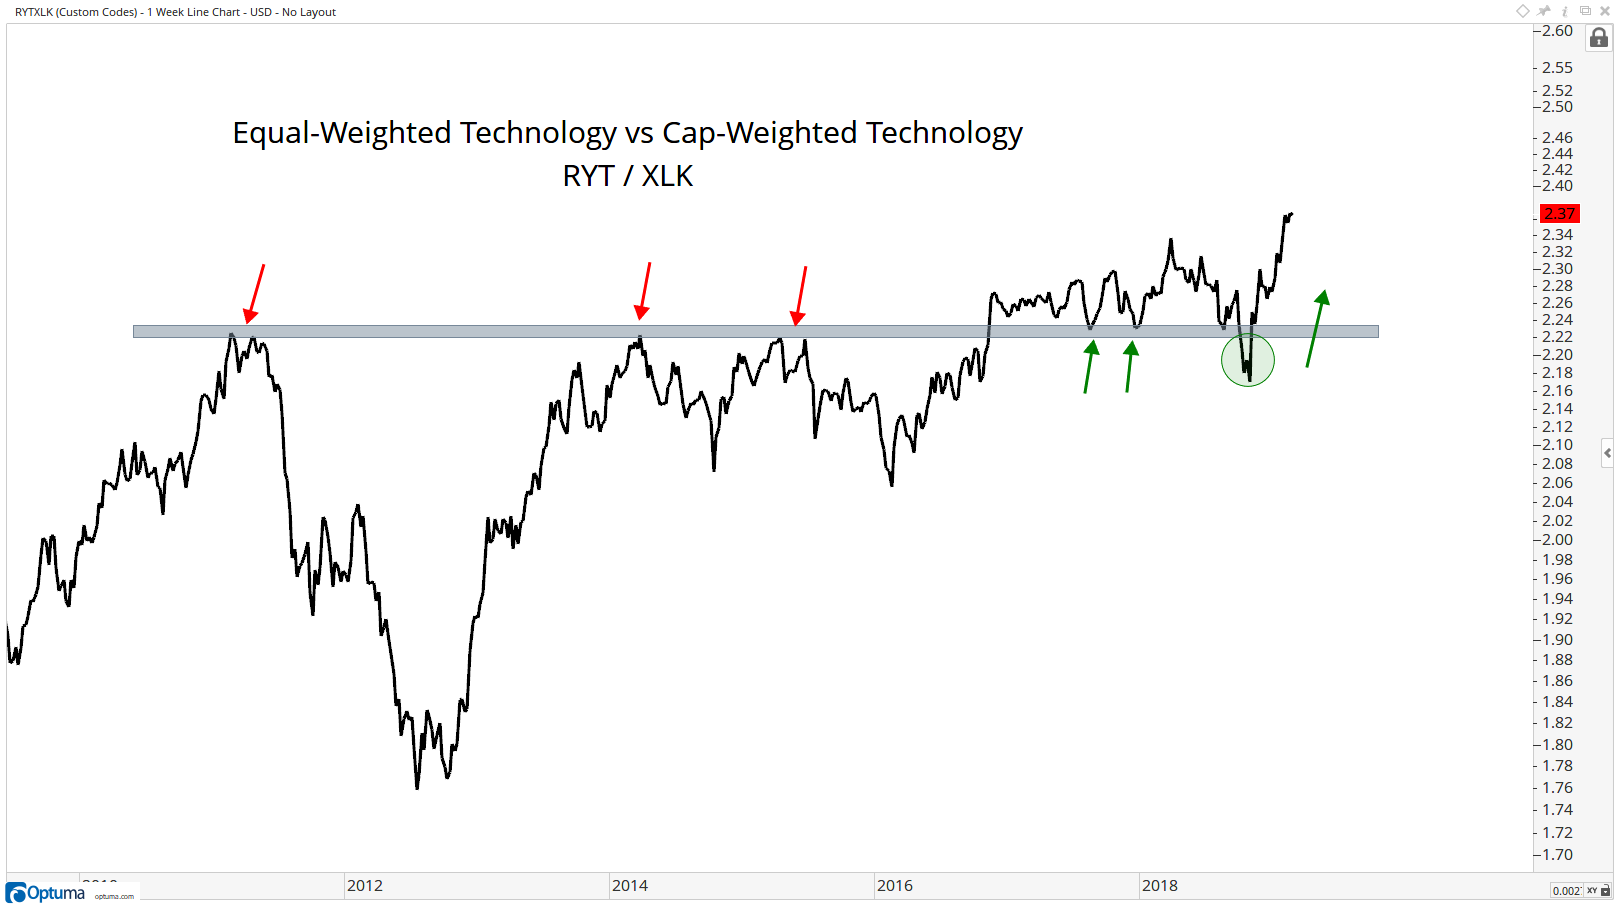
The S&P on an equal-weight basis has led the move higher and taken out the November and December highs before the cap-weighted index.  This suggest broad participation and expansion of breadth.  Meanwhile the equal-weighted tech index is outperforming the cap-weighted tech index.  The FAANG stocks have been a headwind for the cap weighted indices.  If they start to rally this move could really get into overdrive.


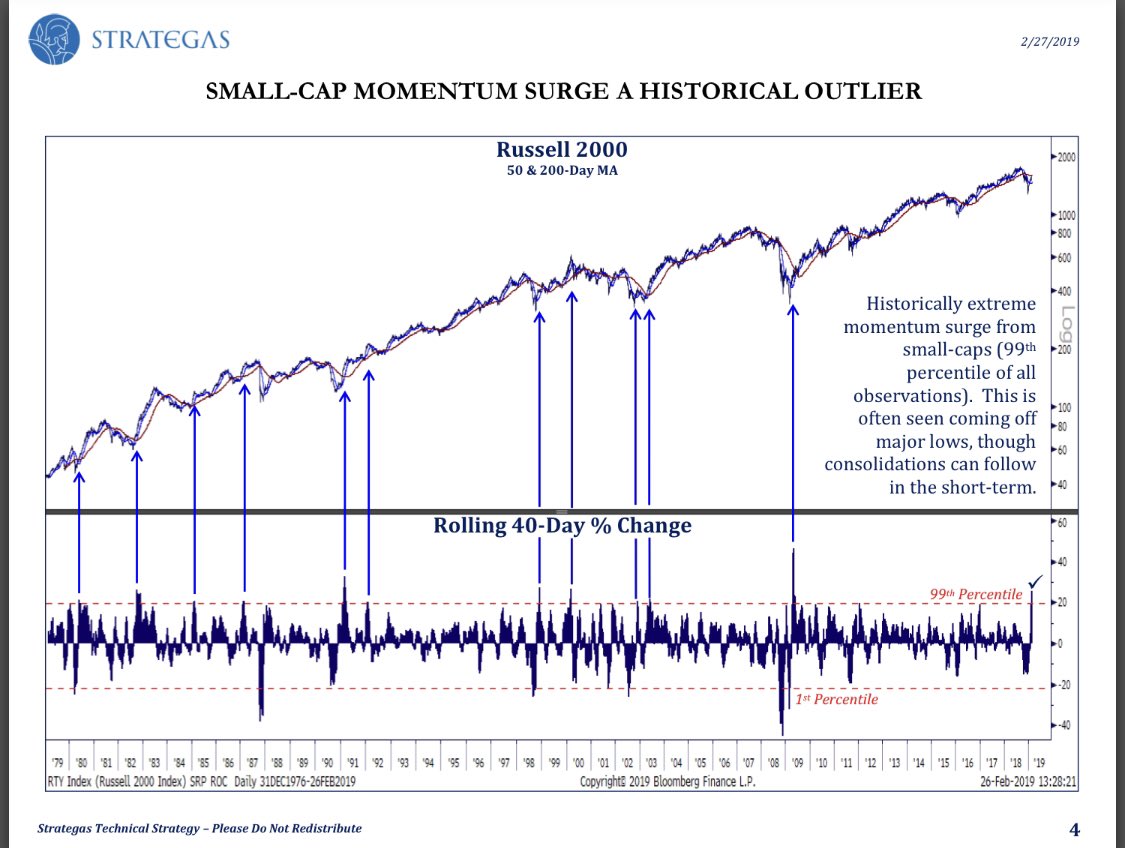
The rally to start 2019 has been nothing short of spectacular.  We remain oversold throughout the rally and their is some evidence that the indices could retrace some of the gains in the short term.  There is typically a period of consolidation after strong rallies. 


40 day % change for small-caps in 99th percentile! Historically rare - data says pause in near term, but better than average returns +6 months forward.


Urban Carmel at the fat pitch blog highlights a case from 1989. DJIA rose 9 weeks in a row and then went into a 10% trading range lasting the next 8 months. It eventually broke out of this range and made a new ATH another 8% higher. The lesson: a set up for a longer term continuation higher can sometimes take a frustrating long time to unfold.


We started this blog with a question about how the current strength positions us for the rest of the year.  In summary, the data suggests a favorable environment for continued gains throughout the year.  Breadth has been expansive, confirming the strong trend higher.  However, there is some evidence that a period of retracement or consolidation is a decent probability in the short term.