Sunday, January 31, 2016

January Recap

At one point in January, the S&P's loss for 2016 had reached 11% (intraday on Jan. 20th) and it looked as if we were on track to log the worst opening month in the market's history.  However, a late month rally repaired some of the damage and the index finished down "just" 5%.


Friday marked the final trading day of the month and its 2.5% surge was easily the biggest up-day of the month and the best day for the market since September.  Since the January 20th "bottom" the S&P has added nearly 4.5% with oil/energy related stocks seeing the largest oversold bounces.  Chart below from Bespoke.


At mid-month, the S&P had just posted the worst 10-day start to a year in history and quickly dove under last August's lows and ultimately traded at levels not seen since October 2014.


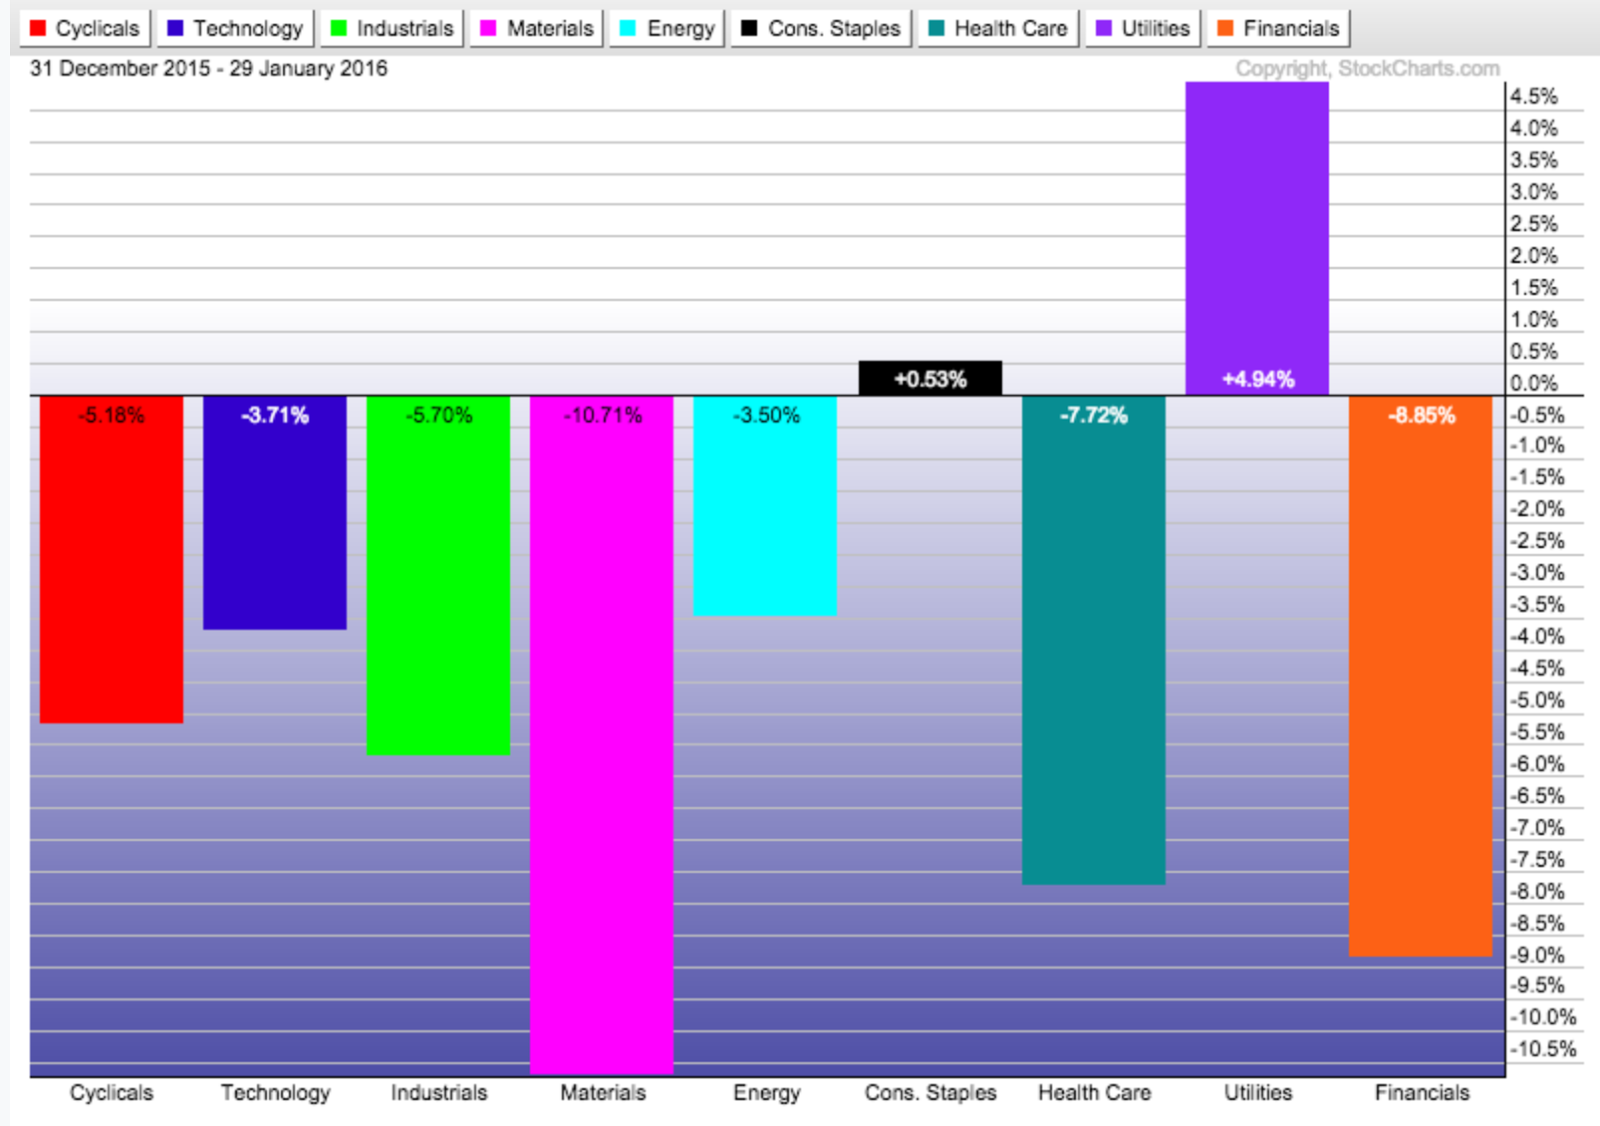
The cause? Well, it looks like a combination of oil's plunge (crude broke below $30/barrel), the slowing Chinese economy and our market signaling to the Federal Reserve that it may want to reconsider any additional rate hikes here in the near-term.  Those headline factors and a continued narrowing of leadership and breadth were enough for sentiment to spoil and left investors seeking the comfort of cash.  Earlier in the week we noted that some rotation was occurring as defensive sectors like Utilities and Staples were being favored.  In fact, they're the only two sectors in the S&P with positive year-to-date performance.


For now, it looks as if the market is enjoying a relief rally that was well earned.  In fact, we noted last week that on one of our measures the market had reached historically oversold levels.  When the S&P was visiting the low 1,800s on January 20th, the percentage of stocks trading above their 200-day moving average had fallen to an incredibly low 11.48%.  This was a number comparable to some of the readings seen during the most severe corrections over the last 20 years.  However, we also made sure to note that the market did not typically register its price lows at the same time.  We cautioned that momentum typically bottoms before price and what we'll often see is price requiring another re-test of the lows (creating positive divergence) before turning higher.

On to February...


Friday, January 29, 2016

Looking For Leadership

Are we in the midst of what will ultimately become a bear market?  That's a question everyone is asking.  A classic symptom of bear markets are that they systematically take out leadership stocks and sectors one-by-one as each counter-rally within the downtrend gets sold off taking more and more names with it each time.

Typically what you'll see during normal pullbacks within sustained uptrends is money rotate into popular, stable names while portfolio managers look to sell the laggards sitting on their books.  This allows for certain pockets to hold up stronger than the general market.  However, what we're starting to see now are some cracks in 2015's "safe haven" stocks and sectors and this could ultimately be what seals the fate of bulls and locks in bear market conditions.

We ran a list of the 9 major S&P sectors and their price performance last year (2015) vs. the start of this year (2016)

Some observations
  • The biggest winners last year were consumer discretionary and healthcare.  
  • So far this year, leadership in healthcare has rolled over with the biotech sector taking the brunt of selling.  Another leader bites the dust. 
  • The leaders so far this year have been utilities and staples (defensive) and their the only two sectors above their 50 and 200-day moving average which says something about the current environment.  Utilities is the only sector that's positive for the year.
  • Financials are the second worst performers this year.  So much for higher rates being positive for this sector.  
  • Energy may have already been capitulated as it was the worst performer last year with a loss of almost 24% while 2016 performance is in the middle of the pack.  We'll see about this.   

Bear or no-bear we believe that a full capitulation needs to happen in which no sector or area is spared for some amount of time.  That means seeing staples, utilities and the remaining individual stock strength will be sold en masse.  That's the way a true bottom is formed.

Regardless of the path, capital preservation feels extra paramount right now.  In this environment, the goal isn't to get rich but rather simply survive.  There will be huge rallies for sure but they will eventually fail until a full capitulation happens.  That happens once all areas of leadership have finally been sold.

On that note, here are some areas of potential support if we break last weeks lows.
  • 1730 which is lows of Feb 2014 and the 38.2% retracement from 2011's low.
  • 1576 which is the prior breakout point from 2007 and coincides with 38.2% retracement from whole move off the 2009 lows. 


Sunday, January 24, 2016

Historically Oversold?

After pulling back to levels (low 1,800's) last visited in April and October of 2014, the S&P 500 was able to stage a massive rally over the last 2.5 trading days of the week to finish above 1,900.  Even with the bounce, the index is still down nearly 7% so far in 2016 and appears to be under severe pressure as the combination of oil being crushed, recession fears, China's slowdown and doubts about the Fed's course of action have put investors on edge.

So it's clear from a "headline" point of view that the market is under a significant amount of stress and with that in mind we wanted to see how current conditions compare to some of the market's more recent challenging periods (1998, 2002, 2008 & 2011)

1998 and 2011 feel as if they are the most appropriate analogs so far as they were corrections within a secular bull market while 2000 and 2008 were within the context of a secular bear.  Nevertheless, they stand out as a few of the more significant pullbacks in the last 2 decades so here we go...

This week the % of stocks above their 200-day moving average reached extreme oversold levels with a reading of 11.48%.  Historically this low of a number has been a good long-term indicator of finding an eventual bottom.  Here's where this gauge bottomed out in the past years referenced and then when the market ultimately bottomed:

8/8/2011 - 11.48% - market didn't bottom until October 4th, 2011
10/9/2008 - 2.12% - market didn't bottom until March 6th, 2009
10/9/2002 - 15.99% - market bottomed one day later but close retest in march of 2003
9/4/1998 - 15.61% - bottomed October 8th, 1998

It's interesting that the 2011 low reading was exactly the same as Thursday's (11.48%).  And the 2002 and 2008 readings bottomed on the exact same day.

If, as we mentioned, this market is more similar to 2011 and 1998 it looks like this reliable longer term indicator may have bottomed.  However, we'll caution that momentum typically bottoms before price and what we'll often see is price requiring another re-test of the lows (creating positive divergence) before turning higher.


1998 (% of stocks above 200 day in red)


2000-2003


2008-2009


2011


2016

Thursday, January 21, 2016

A New Look At Asset Allocation

During the financial crisis, it could be argued that the majority of diversified asset allocation strategies failed to achieve their intended goals as asset class correlations all seemingly dove toward 1.0 as the situation worsened.  This left investors holding a bag full of investments that had collapsed in value.  Equities, parts of the bond markets, commodities, real estate (obviously), and alternative investments (for the most part) were all crushed.  Add to that the illiquidity of certain areas of these markets and people learned that they had really been thrown for a loop by their investment portfolios and the advisors that had pitched them.

In a new study, Richard Bernstein Advisors has set out to prevent such situations from unfolding in the future with their Asset Allocation 2.0 program.  We wanted to share because, at first glance, the concept does seem to have merit.  So many advisors tell their clients that they need to own this or that simply because it’s a “common” asset class.  Well what if many of their other holdings closely resemble it in terms of risk and return profile?  Is that doing more harm than good? In their words:

“Traditional asset allocation models seem obsolete. The much heralded “Endowment Model” failed in 2008, yet asset allocators continue to cling to it as much as the Peanuts character Linus hung on to his blanket. However, the global financial markets have changed dramatically, and the macroeconomic backdrop that fueled the success of the endowment approach no longer exists.

RBA’s approach, Asset Allocation 2.0™, is based on a different asset allocation construct. We no longer pigeonhole investments into traditional categories, such as Large Growth or Value, Small Growth or Value, High Yield or Distressed debt, Absolute Return, or the like. Rather, we group investments based on their returns and risk characteristics.”

RBA’s work argues that, “2008’s asset allocation debacle could have been mitigated or maybe even prevented” had such strategies existed back then.  We’ve linked to their introduction to the study here.

This current correction in the markets so far feels more like your run-of-the-mill pullback (or maybe even a cyclical bear) and not something more sinister like 2008.  However, you never know when a confluence of events can quickly suck asset classes into behaving in similar ways when investors just want to press the sell button.  You should read the paper but if you’re strapped for time we’ve listed their conclusions below:

Conclusions
➜ The so-called Endowment Model failed in 2008, yet investors continue to cling to the framework and ignore that the macroeconomic backdrop that fueled much of the Endowment Model’s success has significantly changed.
➜ Asset Allocation 2.0™ is a different method for allocating assets. Rather than relying on traditional asset categories, it seeks to exploit sensitivities or characteristics within the global financial markets.
➜ Traditional correlation analyses can be manipulated and should be used judiciously. Secular correlations seem much more useful.
➜ There is a spectrum of sensitivities. Investors need to judge the cost/benefit of gaining exposures to those sensitivities.

➜ Asset Allocation 2.0™ is a dynamic process that removes the traditional asset allocation boundaries to search for the most effective way to gain factor exposure.

Thursday, January 14, 2016

Bear Market?

Are we heading for a bear market? Is this just a near-term correction in advance of a move higher? These make for great CNBC segments but instead of predicting what the market is going to do we prefer to base our decisions on what is currently happening.

We find predictions to be rather useless because quite truthfully no one knows where the market is going next.  If you see someone on Twitter or CNBC pounding their chests that their latest prediction did indeed play out, it's more than likely they've got many, many more wrong-calls that they'd love to forget about.  We prefer to deal with scenarios and probabilities and at the end of the day we let the price action guide us.

The trader's prayer is very applicable, "Dear Lord, grant me with the serenity to follow the will of the markets and not my own." (Hat tip to the great Art Holly!)

We track around 70 markets across the globe that span all asset classes.  Currently close to 40% of those markets are in a bear market which we define as being down more than 20% from highs.  Leading the carnage is the commodity space and commodity producing and export driven economies.  Outside of those somewhat obvious areas there is plenty of weakness in biotechs, retail, and homebuilders as well.  The strongest areas remain to be defensive sectors and flight to safety instruments.  When you add this all together you find a global market environment that remains stressed.  The major question facing investors and traders alike is whether this is a correction in a continued bull phase or something bigger.

For now this market remains oversold on various measures that we track while the VIX is elevated.  Below is a list of indicators that are flashing oversold readings on the S&P 500.

Stochastics
RSI
% of stocks above 10, 20, 50, 200 day moving averages
Bollinger Bands
New Highs - New Lows

There's more but basically this market is oversold anyway you look at it.  What worries us the most is that in these conditions you are ripe for a huge short covering, oversold bounce like we have had so many times during the past corrections.  But so far in this pullback, any bounce attempt has been feeble and suggests more downside selling is necessary to flush out the dip buyers.  If the market changes from bullish to bear trend you can expect oversold rallies to be short lived and immediately sold into.  That is classic bear market behavior.   The data also tells us that the biggest rallies happen in bear markets so you have to be prepared for those if you plan to play the short side of this market.

Some other studies that we track that highlight the current market enviroment is correlations.  We'll run sector-to-sector correlations and historical monthly correlations of sectors relative to the S&P.  In a one-way down market everything becomes highly correlated.  As of today we are not at extremes in any correlation measure versus the August bottom.  Another potential tip that more selling is needed.


It remains a volatile environment and certainly one that is dangerous on the long side.  We believe this is a market to keep some powder dry.  If we eventually get a correction that meets the definition of a bear in the S&P 500 the good news is that it will give some absolutely great opportunities on the long side.  Best to avoid the prediction game and maintain the serenity that the trader's prayer asks for.