Tuesday, November 17, 2020

Year End Rally

The markets are rallying hard into year end on the backs of promising vaccine news coming out of multiple pharmaceutical companies and the election out of the way.  This is great news for the country and the world.  The quicker we can get past COVID the better off we all are.  As of this moment, the Russell 2000 is up 16% in November while the S&P 500 is up close to 11%.  The energy sector is up a whopping 25%.  The vaccine news has caused a huge rotation into beaten down sectors as the play on the economy opening back up has been strong.  Meanwhile, traditional COVID stocks have been beaten up in a giant rotation trade.  While we believe the markets will finish the year strong, the renewed optimism in growth may have gotten a little ahead of itself as the markets are now overbought in the short term.  

The recent BAML fund manager survey gives us a good indication on sentiment and positioning of fund managers.  Below are the key takeaways from the November report that shows a shift to a bullish crowd:

Bottom line: the most bullish Fund Manager Survey (FMS) of 2020 on the back of vaccine, election, macro; Nov FMS shows a big drop in cash, 20-year high in GDP expectations, big jump in equity, small cap & EM exposure; reopening rotation can continue in Q4 but we say "sell the vaccine" in coming weeks/months as we think we're close to "full bull".

Cash bears: FMS cash levels sink to 4.1% from 4.4%, now below the pre-COVID-19 level (was 4.2% in Jan), close to triggering FMS Cash Rule "sell signal" (occurs when cash <4% - see Rules & Tools); BofA Bull & Bear Indicator trending higher at 4.2.

Vaccine bulls: COVID-19 remains #1 "tail risk"; but FMS investors continue to pull forward their timing of "credible vaccine", now expected Jan'21 (was Feb'21).

Macro bulls: global growth & profit optimism at 20-year high; big majority (66%) now say macro in "early-cycle" phase, not recession; small majority of CIOs still want CEOs to improve balance sheet (47%), but desire for capex (the 2021 key to sustained economic recovery) on the rise (38%).

Risk bulls: all-time high in FMS investors expecting a steeper yield curve (73%); allocation to equities (net overweight 46%) highest since Jan'18 and close to extreme bullish (i.e. >50%); allocation to cash (net 7%) lowest since Apr'15.

Rotation bulls: Nov FMS shows unambiguous rotation to EM, small cap, value, banks, funded by lower allocation to cash, bonds, staples; note cyclical assets such as EAFE (Japan, Eurozone, UK) and energy stocks lagging the Q4 bullish rotation.

2021 fave trades: asked for their 3 favorite 2021 Year Ahead trades, FMS investors said #1 long Emerging Markets, #2, long S&P500, #3 long oil (Chart 1); FMS investors still regard long tech as by far and away most "crowded trade" in Nov'20.

Nov FMS contrarian trades: Q4 contrarian bulls would position for completion of "full bull" reopening rotation via longs in Japan, Eurozone, UK, and energy stocks; contrarian bears would position for flatter yield curve trades e.g. long staples heading into late-20/early-21 "top".


The bullishness of fund managers is corroborated by other sentiment measures.  Below we can see how optimistic fund managers are, as their optimism increases to highest level since January 2018.  The recent AAII survey is similar as it shows the bulls have the highest reading since January 2018 to go along with the largest weekly jump since July of 2010.   While the CNN fear and greed index is flashing a greedy signal.  On top of that US equity inflows had the second largest increase on record.  


Clearly sentiment has caught up to the aggressive price moves over the last month.  The Russell 2000 is now above its weekly bollinger band and overbought.  We can see the rotation as small caps have outperformed drastically.  This shows up in fund managers over-weighting small caps over large caps.  They also resumed a cyclical rotation into laggards since the election.  


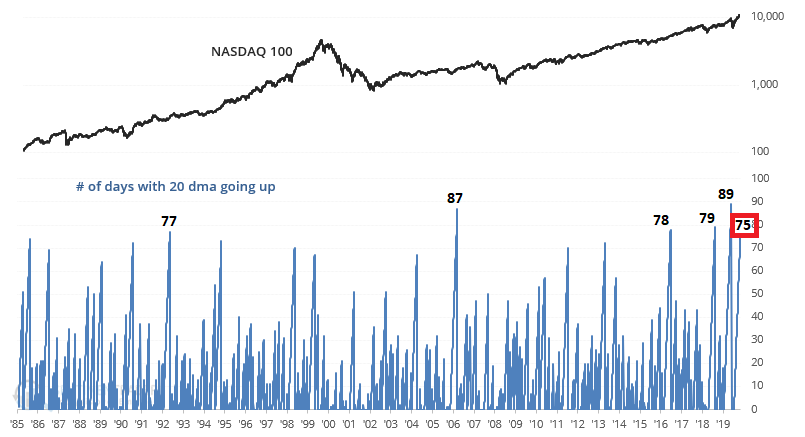
As sentiment has reached excessive levels along with the general market becoming overbought it has created extremely strong breadth readings since the rally off the election lows.  The % of stocks trading above their 10, 20, 50, and 200 day moving averages has surged in the past month as the S&P hit new highs.  

Ryan Detrick, in a recent tweet, confirms this is bullish looking forward when we see extreme breadth. "Last week saw more than 85% of the components in the S&P 500 above their 200-da MA.  This is quite rare and suggests extremely strong breadth and participation.  The future 1,3, 6 and 12 months returns are stronger than average when this happens."


Is the market setting up a false sense of bullishness as we enter the flu season and a spike in COVID cases just as market participants turned excited. Or will traders see through the negative COVID headlines and look beyond that as vaccines get administered, the Fed remains cooperative, and the potential for another round of stimulus?  We believe the market has gotten ahead of itself in the short term and needs some time to digest the new growth narrative and rotation.  However, the trend remains our friend and the path of least resistance remains higher.  Until that changes we see no reason to turn bearish and continue to operate under the assumption the markets remain in a secular bull market with months and years left to run. 

Friday, September 11, 2020

Unknown Knowns

If anything, 2020 has been nothing short of historic and strange for various reasons.  We experienced the fastest bear market in history and one of the most astounding market rallies following.  The Nasdaq just set a record for the fastest 10% correction from all-time highs.  It only took 3 days beating the previous record of 6 days, set in, you guessed it, February of 2020.  All the while during a once in a lifetime pandemic that has besieged the world.  We have witness extraordinarily swift actions from Congress and the Fed on monetary and fiscal policy.  In our last blog post we asked if the market was due for a pause.  Well, we certainly got that wrong as last month was the strongest August since 1984.  Considering the craziness of the first 8 months of the year we could be due for some more unpredictable market behavior over the following few months.  

Time to buckle up because we are in for a potentially wild election season.  The uncertainty heading into this election could be of massive proportions.  Historically, the winner of the election is determined on election night.  Outside of the 2000 election, most are run smoothly.  However, this year could make the Bush/Gore fiasco seem like a walk in the park.  With the amount of mail in voting, and the partisan rhetoric on both sides, we may not have an actual winner for months.  The one thing the markets hate the most is uncertainty.  That is why October of an election year is the worst month all year.  Typically, heading into an election their is enough doubt to keep investors on the sidelines.  This year the anxiety may be at epic levels before and possibly after if we get into a contested election.  

This is all happening as the market enters the weakest month of the year followed by the weakest month (October) in an election year.  Ryan Detrick  shows the returns of all months over four different time frames while highlighting September. 

One of our main concerns we identified in our last post was the excessive move in the indices on weakening breadth.  This negative divergence on its own isn't completely bearish.  What it needed was a break in price to confirm the signal.  The Nasdaq certainly had a break as it had the fastest 10% correction off all-time highs ever while also breaking its trend-line support.  The S&P remains in the channel but is testing the lower trend-line. 


Lets back out and look at a longer term chart of the Nasdaq.  The weekly chart since the 2009 bottom reflects a clearly defined channel.  The Nasdaq has overshot both the top and bottom trend-line support in an extremely volatile 2020 which seems par for the course in a crazy year. 

 Back in an April blog post we shared that we thought the most comparable precedent was the 1998 and 2018 market V-bottom.

Two observations from 2018 and 1998 that might resonate with today's market is what happened after the rally stalled out.  The Nasdaq rallied 78 days in 1998 and 85 days in 2018 before slowing down.  After the rally off the bottom in 1998, the Nasdaq grinded begrudgingly higher in a choppy manner from February to October of 1999 before resuming higher in the ultimate blow off top into 2000.  During the 2018 rally, the Nasdaq went no where from May to November of 2019 in a sideways choppy sector rotation type of market.  If the current rally peaked in the short term on 9/2/20 it would be 113 days from the March lows. 

Considering the excessive move in tech stocks and the over bought nature of the Nasdaq in August, what is interesting about the current market is sentiment never reached an extreme.  The CNN fear and greed index is moderately greedy while the AAII sentiment index is downright bearish. 


The long term trend remains up on the S&P and Nasdaq.  Studies show that strength begets strength and returns should be bullish looking out 6, 12, and 18 months.  However, we have to be open to all possibilities and flexible in our decision making.  We remain bullish and believe the market resides in a new secular bull market.  Yet, that doesn't mean there won't be periods of range bound frustrated trading with corrections and pullbacks.  The current market clearly reflects that risk.  As we enter a seasonally weak time of year coupled with the massive unknown known of a presidential election we prefer to err on the cautious side and don't plan on being overly aggressive on our long book.  Based on prior precedent, the timing makes perfect sense for the market to pause and catch its breadth from the massive run off the March lows.  

Lets take some time to remember those that lost their life 19 years ago and be grateful for the opportunities our great country provides.  Never Forget.

Never Forget 9/11 Pictures, Photos, and Images for Facebook, Tumblr,  Pinterest, and Twitter

never-forget-9-11-september-new-york-twin-towers-photo-picture-facebook-image-frame-07  - Profile Picture Frames for Facebook


Thursday, July 30, 2020

Time for a pause?

It has been a sensational run off the March lows considering we are still in the thick of a pandemic.  The next few months have plenty of known unknowns that could create more volatility than the market has experienced in the last four months.  Whether it is the upcoming election, geopolitical maneuvering with China, daily riots, or just the summer doldrums the market has plenty of news worthy items to answer over the next few months. 

The current market looks and remains bullish as the S&P, Nasdaq, and Russell 2000 all remain above their upward sloping 50 day moving average and in a confirmed uptrend.  The charts below speak for themselves as the last four months, off the March low, has been straight up and to the right.  A classic sign of a trending market.  

Yet, as risk managers we are always looking ahead against potential trouble.  If we look under the surface the existing trend might not be as strong as characterized and is getting a little long in the tooth. A great quote from Paul Tudor Jones in the classic Market Wizards book nails home this point.  "I know that to be successful, I have to be frightened.  My biggest hits have always come after I have had a great period and I started to think that I knew something."

Sentiment trader lastest tweet shows the incredible persistent trend in the Nasdaq and how this usually ends in a pullback, as this is the 6th longest streak ever. 

Image

One area that has put us on watch is the weakening breadth.  Most of this could be a product of 5 stocks now make up 20% of the S&P.  Regardless, we prefer to see expanding breadth rather than a negative divergence.  This can resolve to the upside but it is something to keep on your radar.  Below we can see that the the percentage of stocks trading above their 50-day moving average is declining while both the S&P and Nasdaq continue to rally. 


As we stated earlier the current market looks bullish.  A recent note from the guys at Macro Ops points out that we are likely at the "As Good As It Gets" point with asset returns.  The BofA all-weather portfolio (25% stocks, 25% bonds, 25% cash, 25% gold) has just seen its best 90-day returns in history.  Another example that this market could be exhausted and ready to punish the greedy. 


The weight of the evidence in the longer term suggest higher prices.  We covered many of these in prior posts about strength begets strength.  One interesting stat that provides a bullish case longer term is a study from Ciovacco Capital showing the massive exhaustion in the VIX and how this is actually positive. 


We remain bullish long term as we believe the market is in a secular bull.  Considering the new rounds of stimulus and rates at historically low levels this should bode well for the bull thesis.  But that doesn't mean the market could be ready to take a pause and the evidence in the short term could support that.  As we enter the heart of earnings season we'll be looking to see if the trend can remain up or does the weakening breadth ultimately catch up to prices and the market enters a period of chop and potential draw down.  We attempt to be prepared for any scenario and ultimately price will determine who is right. 

Tuesday, June 9, 2020

New Highs?

We started our last blog with a question, is the bear over?  We highlighted some evidence that put the likelihood a bottom was established in March and suggested we could be in a 1998 environment in which the market V-bottomed and raced to new highs.  Now the next logical question is, are we in a new bull market and are new highs ahead?

What we have witnessed since the March bottom is nothing sort of remarkable.  In the face of the largest pandemic since the early 1900s, stay at home orders, worst economic numbers ever, riots and protest in all major cities, the markets have raced higher just as fast at it collapsed.  This has been the fastest transition from a US bull to bear market in history at 16 days for the S&P and 19 days for the DOW, before turning back into a bull market on April 8th.  The Nasdaq has hit new highs and the S&P is off just 5.5% from all time highs.  This is after both were down greater than 30% just a little over two months ago.  Below shows the V-bottom like behavior in the S&P and Nasdaq since the rally began in late March.  In fact, the S&P 500 just put in the largest 50-day rate of change going back to the 60s.  The next closest was coming off the 2009 bottom.  Not even the 90s has such a strong 50 day advance.  


50-Day rate of change for current market

2009 50-Day rate of change  


 1990s 50-Day rate of change


Ryan Detrick compares bear markets and the subsequent rallies in his recent tweet.  If the S&P takes out new highs in the next few months this would be one of the fastest bear market recoveries ever.

 Image

Below shows just how powerful this current rally is as it compares to the greatest rallies of all time.  

Image

The one thing that has lacked coming off the bottom has been breadth.  The market rallied on the back of narrow leadership that were deemed the winners in the work from home plays.  However, as states have slowly started to reopen breadth has exploded and participation is now broad and wide.  Currently over 90% of all stocks are trading above their 40 day moving average.  Below is a study from Ned Davis that shows the past instances (marked by arrows) where this short-term breadth indicator crossed above 90 after falling to at least 75% in between. Out of the 19 cases, the market was up a year later each time with a median return of 16.28%.


Outside of the reasonable case that the coordinated actions of monetary and fiscal stimulus have turbo charged the rally one less obvious stat caught our attention.  An interesting note from Jeffries shows the U.S. has witnessed a cratering in the number of publicly traded companies in the last two decades – a trend that doesn’t seem poised for a rebound in 2020 with capital markets’ activity declining considerably. And while net leverage has crept up from a few years ago, it remains half of what it was in the mid 1990s. Due to the growth of passives, there has also been the knock on effect of higher concentration, with five houses owning, on average and in aggregate, about 20% of many companies in the U.S.  Another way of looking at it: if the equity universe were a neighborhood:
• There would be fewer houses
• But these houses would be bigger, on average (by market cap)
• And they would be held by a smaller number of owners


On top of this, sentiment isn't euphoric even after the greatest 50 day move in the S&P.  That makes us hopeful for the trend to sustain and the bull to continue.  The most recent AAII sentiment survey shows a higher than normal level of bearishness along with below average bullishness.  This isn't wild extremes by any measure.


In the short term we don't want to be too aggressive considering we are overbought and have run so far so fast.  The 14-day RSI on the S&P just hit overbought levels for the first time since the rally started.  This isn't sell signal alone but just makes us aware that the markets are overheated in the short term.


Along the same lines, the put call ratio has collapsed from massive fear to complete complacency.  This tweet from David Larew displays the wild swings.

Image

In summary, the current rally has produced a historic move off the bottom and has started to broaden out which is bullish for a sustained advance and new highs.  Yet, in the short term we could see some give back considering the overbought nature of the markets and how fast they have run up.  The only thing I know is what I don't know.  As markets change we will revisit and adjust our plan accordingly.  Until then stay safe and healthy.