Showing posts with label Divergence. Show all posts

Wednesday, May 13, 2026

The Divergence Trap: When the Index Lies and the Tape Tells All


In the world of growth equity, a rising Nasdaq is usually a reason to celebrate. But as we navigate this mid-May tape, the headline numbers are telling a very different story than the individual stocks. We are witnessing a massive breadth divergence—a scenario where the "Generals" are charging up the hill while the "Soldiers" are quietly retreating to the barracks.

For a long-short manager, this is one of the most dangerous psychological environments. If you only look at the index, you feel like you're missing a party. If you look at your P&L, you feel the friction.

The Math of the "Thin" Rally

The data behind this divergence is striking. While the Nasdaq 100 has pushed toward the psychological 30,000 mark this week, the foundation underneath is thinning out:

  • The 50-Day Fatigue: As of today, only 49% of S&P 500 stocks were trading above their 50-day moving average. In a healthy, broad-based bull market, we want to see that number closer to 65-80%.

  • The New High Gap: While the index prints fresh all-time highs, the number of individual stocks making new 10, 20, and 50-day highs has been steadily declining since mid-April.

  • Sector Isolation: It has become a two-sector market. Only Technology (XLK) and Real Estate (XLRE) have managed to sustain new highs this month.

The Binary Endgame: Catch Up or Succumb

When a market becomes this bifurcated, there are ultimately only two outcomes. We are at a "fork in the road" for the current regime:

  1. The Expansion (Catch Up): The "Soldiers" finally hear the bugle call. Buying pressure rotates out of the mega-cap AI leaders and into the broader market, lifting the 50% of stocks currently stuck below their moving averages. This is the "soft landing" for the rally, where breadth expands to support the index's lofty valuation.

  2. The Gravity (Succumb): The weight of the 50% of stocks in internal distribution finally becomes too much for the leaders to carry. The "Generals" (Semis and AI) eventually succumb to the surrounding weakness, and the index corrects violently to meet the reality of the average stock.

Why This Matters for Your Portfolio

A rally without breadth is like a house built on toothpicks. It looks great from the outside, but it can't handle a heavy wind.

  • The "Air Pocket" Risk: Because the index is held up by so few names, any weakness in those leaders can create an "air pocket" where the index drops rapidly.

  • Respect the Friction: If the Nasdaq is up 1% and your long positions are flat or red, listen to the tape. Your P&L is telling you that the risk-reward for broader growth is currently poor.

The Game Plan: Surgical Exposure

At Worch Capital, we don't fight the index, but we don't ignore the divergence. We are moving stops to break-even on names that aren't showing immediate "traction." We avoid the "laggard trap", buying stocks just because they are "cheap", and remain perfectly comfortable sitting in cash. We are waiting for the market to prove which of the two outcomes will win: will the soldiers join the fight, or will the generals finally fall?

Wednesday, December 1, 2021

Is the Fed going to burst the bubble?

At some point this market will have a bear market and very well could coincide with a rising rate environment. Trying to time or predict when it will happen is fool's gold. What we do know from market history is that pullbacks, corrections, and bear markets are a normal part of investing. A pullback is defined as a decline of 5% to 9.9% and occurs on average 2.5 times a year. Corrections (10% to 19.9% selloffs) happen every one and half years and a bear market (>20% loss) nearly every three years. A study from JP Morgan says the average intra-year drawdown in the S&P 500 is 14.3%.


A good example is 2021 which has been in a sustained bull market. The S&P 500 has experienced two pullbacks in 2021 while maintaining a strong uptrend. Meanwhile, the Nasdaq has been through four such pullbacks this year in what has been characterized as a volatile climate for growth stocks. Trying to rationalize every wiggle in the market is another futile exercise. Regardless of how you calculate the data, selloffs happen and happen more often that thought for various reasons. 

The latest excuse for market weakness: Fed's tapering of liquidity, Omicron variant, debt ceiling, etc. Yet if look back at history to the last taper tantrum in May of 2013 the S&P sold off 5.8% in the next month but rallied 17.5% for the rest of the year. According to Sam Stovall at CFRA Research, "After a very minor pullback known as the 'taper tantrum' stocks took off. Above average market returns across all styles, sectors and up to 80% of all sub-industries. That goes for not only the market rebound after the "tantrum" but the 10-month period that included the actual Fed tapering activity. In the 10-month tapering period, from mid-December 2013 to the end of October 2014, the S&P 500 rose 11.5%, according to CFRA Research. The likely reasoning, Stovall says, is that investors concluded if the economy was strong enough to withstand the removal of supportive bond-buying activity, it was healthy enough to continue to expand on its own."

At Worch Capital, we believe the eventual bear market will be brought on by a move in interest rates or an unpredictable market event outside of the normal business cycle. If history is any guide we should be due for one around the summer of 2022. These numbers are based on averages and can vary wildly. For reference, the longest bull market lasted almost 8 years, so anything is possible. So with all the recent doom and gloom I wanted to look at some data that shows some potentially bullish signals going forward.

While the Federal finances are a mess, consumers are showing an extremely healthy balance sheet as total assets are hitting new highs while personal liabilities are making new lows. 


Charlie Bilello had a recent tweet showing the VIX had the 4th largest one day % increase in its history as it rose 54% on 11/26/21. His key takeaway: "the market tends to rise over time and tends to rise more following volatility spikes (note: on average, there are always exceptions and this latest spike could very well be one).


His data shows the S&P has been higher one year later every single time the VIX has spiked 40% or more. Our own data confirms this, but has one negative period one year later which was in 2007. Below is data on the Nasdaq's performance after a VIX spike of 40% or more. 


 Between the two studies the S&P and Nasdaq average 20%+ returns a year later after a VIX spike.
  

Another study by Ryan Detrick at LPL Research shows "that when stocks are up more than 20% for the year heading into December (like 2021), the final month actually does better, up 1.7% versus 1.5%. Also, it has been higher eight of the past nine times the year was up more than 20% heading into the final month.


One area that we monitor that is worrisome is the massive divergence in breadth. These divergences can last months and sometimes years and most of the time they reverse themselves. But when you get a hard break in the markets accompanied by weak breadth that is usually a time to play more defense than offense. For now the market indices have maintained their up-trends. The weak breath proves how narrow this market remains with a handle of mega caps holding up the indices. Underneath the surface many stocks are well off their 52-week highs. Unless this current turbulence turns into the next bear market (ie: 2018 and 2020) the current weakness is getting very close to oversold levels and where the market has usually found buyers. Below is the % of stocks trading above their 50 day moving average on the Nasdaq. The yellow lines show areas where the market found a low and started to bounce. 

At the end of the day price pays. But the data above gives some comfort to the bulls. It is never easy and sometimes very messy but focusing on fear mongering is not a good strategy. There are always things to worry about in investing. We try and parse the data and come up with a thesis. Yet, when price diverges from that thesis we adjust accordingly.


Friday, September 11, 2020

Unknown Knowns

If anything, 2020 has been nothing short of historic and strange for various reasons.  We experienced the fastest bear market in history and one of the most astounding market rallies following.  The Nasdaq just set a record for the fastest 10% correction from all-time highs.  It only took 3 days beating the previous record of 6 days, set in, you guessed it, February of 2020.  All the while during a once in a lifetime pandemic that has besieged the world.  We have witness extraordinarily swift actions from Congress and the Fed on monetary and fiscal policy.  In our last blog post we asked if the market was due for a pause.  Well, we certainly got that wrong as last month was the strongest August since 1984.  Considering the craziness of the first 8 months of the year we could be due for some more unpredictable market behavior over the following few months.  

Time to buckle up because we are in for a potentially wild election season.  The uncertainty heading into this election could be of massive proportions.  Historically, the winner of the election is determined on election night.  Outside of the 2000 election, most are run smoothly.  However, this year could make the Bush/Gore fiasco seem like a walk in the park.  With the amount of mail in voting, and the partisan rhetoric on both sides, we may not have an actual winner for months.  The one thing the markets hate the most is uncertainty.  That is why October of an election year is the worst month all year.  Typically, heading into an election their is enough doubt to keep investors on the sidelines.  This year the anxiety may be at epic levels before and possibly after if we get into a contested election.  

This is all happening as the market enters the weakest month of the year followed by the weakest month (October) in an election year.  Ryan Detrick  shows the returns of all months over four different time frames while highlighting September. 

One of our main concerns we identified in our last post was the excessive move in the indices on weakening breadth.  This negative divergence on its own isn't completely bearish.  What it needed was a break in price to confirm the signal.  The Nasdaq certainly had a break as it had the fastest 10% correction off all-time highs ever while also breaking its trend-line support.  The S&P remains in the channel but is testing the lower trend-line. 


Lets back out and look at a longer term chart of the Nasdaq.  The weekly chart since the 2009 bottom reflects a clearly defined channel.  The Nasdaq has overshot both the top and bottom trend-line support in an extremely volatile 2020 which seems par for the course in a crazy year. 

 Back in an April blog post we shared that we thought the most comparable precedent was the 1998 and 2018 market V-bottom.

Two observations from 2018 and 1998 that might resonate with today's market is what happened after the rally stalled out.  The Nasdaq rallied 78 days in 1998 and 85 days in 2018 before slowing down.  After the rally off the bottom in 1998, the Nasdaq grinded begrudgingly higher in a choppy manner from February to October of 1999 before resuming higher in the ultimate blow off top into 2000.  During the 2018 rally, the Nasdaq went no where from May to November of 2019 in a sideways choppy sector rotation type of market.  If the current rally peaked in the short term on 9/2/20 it would be 113 days from the March lows. 

Considering the excessive move in tech stocks and the over bought nature of the Nasdaq in August, what is interesting about the current market is sentiment never reached an extreme.  The CNN fear and greed index is moderately greedy while the AAII sentiment index is downright bearish. 


The long term trend remains up on the S&P and Nasdaq.  Studies show that strength begets strength and returns should be bullish looking out 6, 12, and 18 months.  However, we have to be open to all possibilities and flexible in our decision making.  We remain bullish and believe the market resides in a new secular bull market.  Yet, that doesn't mean there won't be periods of range bound frustrated trading with corrections and pullbacks.  The current market clearly reflects that risk.  As we enter a seasonally weak time of year coupled with the massive unknown known of a presidential election we prefer to err on the cautious side and don't plan on being overly aggressive on our long book.  Based on prior precedent, the timing makes perfect sense for the market to pause and catch its breadth from the massive run off the March lows.  

Lets take some time to remember those that lost their life 19 years ago and be grateful for the opportunities our great country provides.  Never Forget.

Never Forget 9/11 Pictures, Photos, and Images for Facebook, Tumblr,  Pinterest, and Twitter

never-forget-9-11-september-new-york-twin-towers-photo-picture-facebook-image-frame-07  - Profile Picture Frames for Facebook


Tuesday, October 16, 2018

Are we entering a bear market?

Historically the month of October is known for its volatility and so far it has not disappointed.  The explosion in volatility the first few weeks have coincided with a market correction.  A lot has happened in the last two weeks so lets get to the data.

The old saying, markets take the stairs up and elevator down certainly applies to the current pullback.  Months of gains have been evaporated in days as the speed of the downside move was violent.  However, so far the correction has been contained as the four big equity indices have losses ranging from 7 to 12%. 

Russell 2000   -12.4%
S&P                -7.8%
Nasdaq           -10.5%
Dow               -7.6%


If we take a longer term approach the S&P has declined to the up trend-line channel support from the 2016 lows and the 200 day moving average.   In the meantime, volatility has risen dramatically and we are hitting oversold levels that are consistent with prior bottoms.  Typically the index will take a few weeks or months to find a true bottom.  Many times it will retest the first reaction low after a failed attempted rally which would bring last Thursday's low into play.  Assuming the markets remain in a bull trend, it is highly likely that the markets are closer to establishing a low and turning higher.  Of course, our assumptions could be wrong and instead this could be the beginning of a bigger downturn.  Over the next few weeks we will be looking for some evidence that the selling is exhausted so the markets can move higher.  Until then, patience and caution is warranted.


Breadth has been lagging for months and price finally broke down from the negative divergence.  However, we are seeing a massive flush in breadth as the percentage of stocks trading above their 50-day moving average is at levels typically associated with a market bounce.  


Sentiment has reversed and become washed out creating a contrary buy signal.  According to the October BAML fund manager survey, allocation to US equities reverses much of the climb in Aug/Sept falling 17 ppt to 4% overweight.  The US is no longer the most favored equity region globally.  FMS investors are the most bearish on global growth since 2008 as cash has become a crowded position.  On top of that the current CNN fear and greed indicator is flashing extreme fear.


The quantitative data sets up favorably for the remaining year and even into next year.
Below are some quantitative studies, courtesy of Nautilus research, that show how current momentum justifies future upside. 
  • A new multi-year high for the Dow for the first time in six months is a powerful trend following signal. 6-month gains average +6% (30 up vs. 7 down) going back to 1900. 
  • When the SPX and the DOW both make multi-year highs on the same day for the first time in six months, gains for the SPX average +11% one year out and +20% two years out. The Dow Industrials tend to perform similarly. 
  • Further, please note that when the DOW Industrial Index is up between 5% and 10% through 9/20, returns for the rest of the year average +7.53% (9 up vs 1 down), while the SPX gains an additional +6% through year end (9 up vs 0 down). 
  •  Since 1927, when the SP500 is up more than 8% through September, rest of year gains have averaged +4.02%. (31 up vs. 7 down).  
  • Since 1927, when Q3 returns for the SPX exceed 7%, 6-month returns average +9.31% (17 up vs. 5 down) while 3-month returns average 4.53% (18 up vs 4 down). 
  •  The SPX just notched 6 straight consecutive monthly higher closes. 3-month returns average +3.85%. (23 up vs 4 down).
In summary, while the recent correction has wiped out months of gains, the pain is always worse on the downside.  Volatility has exploded but has created a wash out in breadth and sentiment.  Along with the favorable quantitative data, the recent flush has reset expectations allowing for a potential year end rally.  The odds favor a bottom being creating over the next few weeks rather then this turning into a full blown bear. 

Thursday, July 19, 2018

Is current breadth worrisome?

Price action remains bullish as the Nasdaq is at highs and small/mid caps are within spitting distance of new highs.  The S&P is above the 2800 resistance level as the NYSE and Dow remain in consolidations.  It is a good exercise to look under the hood to see what is driving the indices and see if we can gain any insight.  The one thing that worries us is the lack of breadth has not followed price action higher.  The overall Advance/Decline line in the Nasdaq and S&P remains bullish yet some more subtle shorter-term breadth figures paint a different story.  Below are some of the breadth indicators showing negative divergence:
  • Nasdaq new 52 week highs
  • Nasdaq % of stocks above 50 and 200 day moving average
  • S&P new 52 week highs
  • S&P % of stocks above 50 and 200 day moving average


For the indices to maintain new highs or recent strength they will need to have broad participation to follow though to the upside.  With the VIX at complacent levels it won't take much to spook the market especially with thin leadership.  This will be something to watch over the next few weeks as a plethora of earnings are released.  Will participation escort price to new highs or will price succumb to a lack of leadership and retreat?  

Wednesday, April 18, 2018

Poised to run higher


After yesterday's strength all four of the major index's are now above their respective 20, 50, and 200 day moving averages.  This along with a positive divergence in breadth is a good sign.  With the A/D line breaking out to new highs on the S&P the index's are set up to follow through with strength.   Breadth in the form of sector participation is also healthy as all 10 of the major S&P sectors are now above their 20 day moving average.  Even ex-US index's are pulling their weight as the majority are above their 50 day moving average.  From a trend and breadth perspective the narrative has become more bullish the last few days. 


If we turn our attention to the April fund manager survey we can gain some insight into fund managers positioning and sentiment.

Below is a recap of the April FMS:
  • Bulls silenced, not routed: risk assets can bounce, but SPX 2550-2850 range holds 
  • Cash jumps from 4.6% to 5.0% (Exhibit 1), equity hedging levels @ 18-month highs…
  • …18-month lows in FMS global growth & profit expectations, equity allocations…
  • …and record # investors say companies excessively levered
  • But true FMS bull capitulation absent…just 13% say recession likely, only 18% say stock bull market has peaked…
  • …and asset allocators still married to TINA (there is no alternative - equities>bonds) until UST10Y hits 3.5%
  • #1 “tail risk” = trade war (China, Germany markets most vulnerable)
  • Top “crowded trades”: #1 long FAANG+BAT, #2 short US$, #3 long credit
  • April rotation out of stocks, tech, banks, Japan; tech allocation lowest since Feb’13 on Occupy Silicon Valley & trade fears
  • April rotation into cash, commodities (8-year high), energy, UK (biggest post-Brexit)
  • FMS contrarian trades: long government bonds; long US dollar, short EM equities; long liquid defensives (e.g., pharma, staples), short cyclicals (banks, consumer discretionary)
FMS cash jumped 0.4% to 5% continuing the FMS cash rule contrarian "buy" signal.  Allocations to global equities fell to 18-month low of 29% from net 41% overweight in March.  Allocation to commodities rose 4% to 6% overweight, the highest since April 2012 when WTI was $105/bbl.  Meanwhile investors that are hedging their portfolios is at an 18-month high. 


Is the worst behind us and is the market poised to run higher?  The weight of the evidence confirms the trend has turned higher with a positive confirmation in breath.  There is certainly plenty to worry about with trade wars, Syria, and the Fed.  However, with earnings season about to get into full swing coupled with tepid sentiment, the foundation is set for a test of new highs. 


Tuesday, March 20, 2018

Post Correction

It has been about a month since the market bottomed and corrected roughly 12% from peak to trough in all of 10 trading days.  Since the trough low and reversal day on February 9th the S&P has rallied 10% off the lows in a choppy fashion.  The leader from the lows has clearly been in technology stocks as both the Nasdaq and NDX have rocketed back to new highs on their rally attempts.  The current weakness has taken both of these indices below their prior highs creating a potential double top.  The good news is the big four indices have made higher lows over the last month setting up a wedge formation.  What is more concerning is the negative divergence in momentum and breadth that has been created as price was making new highs in the Nasdaq and NDX.  Both the RSI and % of stocks trading above their 50 day moving average failed to confirm new highs.  Typically markets roll over when not accompanied by strong breadth and momentum readings.


Another area we'll be watching on a longer term chart is the 20 week moving average accompanied by the bollinger bands.  Urban Carmel over at the Fat Pitch blog had a nice review of how this has played out in prior instances.  "It's a reasonable guess that the next time the 20-wma is tested, it will break and SPX will complete its full retest of the February low. It's also a good guess that a trip to the lower Bollinger is in store for 2018. The long uptrend in 2013 weakened in 2014 and ultimately broke at the end of that year."(See Chart Below)  If he is right and the S&P doesn't hold the 20 week moving average we could be heading to the lower bollinger band around 2550 which would bring in a test of the February lows. 


Since the February 9th bottom, performance has been led by tech and financials.  However, if we break down the performance among S&P sectors over the last month we can see an interesting trend.  Technology still leads the way as the dominant sector as we discussed above but the second biggest move has been utilities.   This has a defensive undertone.


If we turn our attention to the monthly BAML survey to get a read on fund managers sentiment and positioning it can confirm some of our own findings.  The most crowded trade is long FANG stocks while short volatility slips to sixth from 1st in January.  At the same time, March rotation shows investors reducing risk by increasing defensive allocations.  Not surprising, threat of a trade war is back as the biggest tail risk for fund managers overtaking inflation.  74% of investors now believe the global economy is in "late cycle", the highest on record.  Respondents think 3.6% is the "magic number" to cause investors to rotate from equities back into bonds while 58% of FMS investors think global corporate earnings will rise 10% or more over the next 12 months. 


The market sits at an important juncture after rallying off the February lows.  The next few days and weeks will go a long way in determining the direction of the trend.  If the downside of the wedge pattern and the 20 week moving average give way it could set up a test of the February lows.  If the market holds current levels and breaks to the upside there could be a sprint to new highs that catch traders flat footed.  For the trend to resume higher it will need to be accompanied by breadth and broader sector participation outside of technology.  With expectations that earnings will continue to grow we believe any pullbacks should be well contained.  However, considering the highest recorded reading of investors believe the global economy is in the late cycle phase we still expect to have bouts of heightened volatility.  Tomorrow's FOMC meeting will give us plenty to talk about with regards to the economic outlook, bond yields, trade wars, and the Fed's positioning.  

Tuesday, November 14, 2017

November Fund Manager Survey

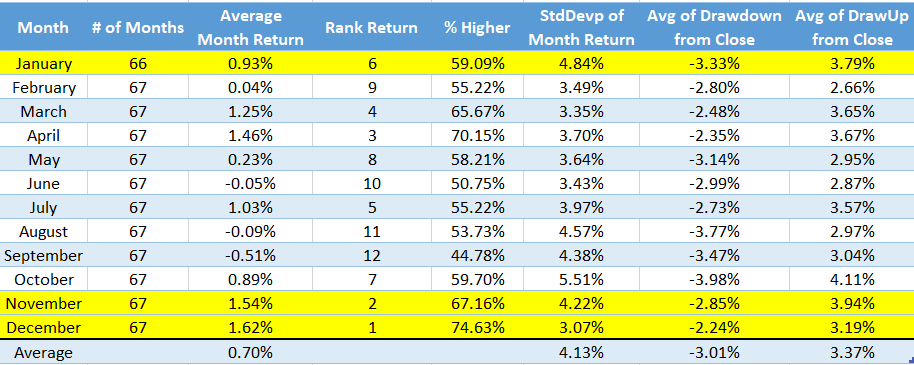
Over the past few blogs we have looked at why the market could be due for a pullback.  Outside of the Russell 2k the majority of the big indexes have lugged higher with a persistently strong trend.  As we enter the historically strongest 3-month period in the market and with the potential for tax reform on the horizon we remain bullish till year end.  What we found interesting in the monthly data is that if we only looked at the last 20 years the trends change.  This certainly has a lot to do with the 2 major bear markets we have experienced but nonetheless the findings are intriguing.  Especially the weakness in January the last 20 years versus the larger time period.  Considering the strength of the market this year it would make sense to push off selling winners until 2018 especially if tax reform is accomplished.  This could bring in some volatility in the beginning of the new year.  Below we look at the monthly performance of the S&P 500 going back to 1950 and the most recent 20 year period.  Since 1950, the Nov-Jan period is the strongest 3-month period historically.  If we limit it to the last 20 years it ranks as the 5th strongest 3-month period, although November and December are very strong in both time frames.  This should bode well for a strong finish to year end. 


In our role of portfolio management we always want to play devils advocate and poke holes in our thesis so we don't turn a blind eye to potential pitfalls.  The data above certainly paints a bullish picture the next few months.  In our last blog on divergences we highlighted how momentum has peaked creating a negative divergence.   Below we look at the recent weakness in high yield and what that may forecast for the equity markets.  We can see in 2017 when high yield index has broken down this leads to a slow down in equity markets.  Is this time different?  We don't have the answer to that but it is something we continue to monitor. 


If we turn our attention to the monthly fund manager survey (FMS) from BAML, there are a some levels that are flashing a more cautious tone.  Below is a recap of the current month takeaways straight from the November report.
  • It’s frothy FAANG: big market conviction in Goldilocks (+ price action in FAANG/BAT,
    Bitcoin) leading to bull capitulation; FMS risk-taking hits all time high (Exhibit 1), cash
    decisively lower despite record high saying equities overvalued (= irrational
    exuberance)…our conviction in winter post-tax reform risk asset correction hardens
  • Consensilocks: all-time high Goldilocks expectations (56% expect “high growth, low
    inflation”); contrasts with tumbling bear view of secular stagnation as macro backdrop
    (was 88% Feb’16, now 25%); US tax reform expected to sustain or inflate Goldilocks
  • Ever closer to the sun: Nov FMS cash level drops to 4.4% from 4.7% = lowest since
    Oct’13 & no longer a “buy signal”; FMS hedge fund equity exposure at 11-year high;
    BofAML Bull & Bear Indicator up to 7.2 but sell-signal not yet triggered
  • Correction catalysts = inflation & market structure: biggest FMS risk to EPS =
    wage inflation; rising FMS concerns re “market structure” (3rd biggest tail risk);
    strategies most likely to exacerbate correction…vol selling (32%), ETFs (28%), risk parity
    (16%)
  • Notable FMS takeaways: crowded trades are #1 long Nasdaq, #2 short volatility, #3
    long credit; highest global equity OW since Apr’15, highest Japan OW in 2-years, an epic
    FMS UW in UK assets, and big Nov rotation to energy from bank stocks
  • Contrarian stagflation trades: long UK, short Eurozone; long pharma, short banks;
    long utilities, short tech
The first few charts should be grouped under opposite opinions.  There are a record number of managers taking higher than normal risk as hedge funds net equity exposure rises to an 11 year high of 47%.  In the same breadth those same fund managers say that equities remain at excess valuations but are putting cash to work with cash levels falling to 4.4%.  Our own opinions make us think that under-performing fund managers are willing to risk capital over the next few months to try and catch up to their benchmarks regardless of the stretched valuations presented.  From a global economic outlook the data remains favorable.  This is displayed in the fund managers expectations of the global economy in the next 12 months.  Expectations in the "Goldilocks" scenario (above-trend growth and below-trend inflation) rose 8ppt to 56% which is another record high.   


We'll leave you with one more data point we recently read that pique our interests.  Jason Goepfert from Sentiment trader wrote this last night:

The S&P’s split personality.  Last week, there were a lot of buying climaxes (reversals from 52-week highs) in S&P 500 stocks - 32 of them, which was up from 20 the prior week. There were also a lot of selling climaxes (reversals from 52-week lows), 17 of them, which is highly unusual in a week when there were so many buying climaxes. Usually there are many of one or the other, not both. The only time we’ve seen so many of both kinds of reversals, showing a highly split market, was in March 2000.

Once again we have presented alternative view points for both bulls and bears to consume.  We remain firmly in the bullish camp as we continue to operate within our secular bull market assumption.  However with some negative divergences appearing along with some inflated conditions to the upside we have some cash on the sidelines to put to work on any weakness as we look for a strong close to year end. 

We hope everyone has a safe and wonderful Thanksgiving!  We certainly are thankful over at Worch Capital for all blessings we have. 
 

Tuesday, November 7, 2017

New highs but signs of divergences

The market indices continue to chug along as they steadily make daily new highs with the exception of small caps which have lagged recently.   We have not touched on correlations of late but this has proven to be the year of stock picking.  During most of the QE environment from the market bottom in 2009 correlations remained abnormally high as asset classes and sectors followed each other in the same direction in a herd mentality fashion.  However sector correlations have completely diverged throughout 2017 and are hitting the lowest levels by a wide margin.  Below we look at the 30-day average correlations of the major S&P 500 sectors.  We overlaid the trend of the S&P 500 during the same time frame.  It clearly illustrates how 2017 has been a stock pickers year as correlations have collapsed.  We believe this is another endorsement for active management going forward.


Below is a great blog post from Chris Kimble that highlights the divergence in equal and market capitalization indexes.   This shows how a few big cap stocks (think FANG stocks) that have performed well are propping up the indices.  The equal weighted indexes are under-performing the cap weighted indexes by a whopping 25%.  We also see this divergence in our own breadth indicators.  One simple one we follow is the amount of stocks trading above the 20 and 50 day moving averages.  The second chart shows how momentum has peaked prior to price displaying a negative divergence.  This usually is resolved to the upside but we can see typically when momentum fades this tends to lead to a level of consolidation or pullback before breadth picks up and momentum resumes. 


The S&P remains overbought and with momentum fading we could be in for some short term weakness as the market digests the recent gains.  However, as earnings season had been favorable to equities and with the potential for tax reform this should keep a bid in the market.  Coupled with correlations at multi-year lows this sets up nicely for an active manager assuming you are positioned in the right areas, as we think the strong will get stronger and the weak performers will be under tax selling till year end.