At Worch Capital we are big believers in pattern recognition. The famous quote from Mark Twain that history does not repeat itself but it does rhyme is very appropriate in trading the markets. As a student of markets we look for historical precedent to shape our thesis. We then let Mr. Market decide if we are right or wrong as price pays at the end of the day. We are also not big believers in making predictions as most are useless and wrong. Sure, you can eventually be right on a market call but if your timing is way off you can go broke trying to prove your viewpoint. As we embarked on our weekend research I wanted to look at the current pullback and compare it to prior pullbacks to see if I can discern any similar patterns. I came away still convinced we remain in a secular bull based on the weight of evidence presented in the major indices we track and follow. We look at short(20day), intermediate(50), and long term(200) trend-lines to identify where the markets are in their current position. The SPY, QQQ, and IWM remain in strong long term uptrends as their 40 week (blue line) moving average (200day on daily chart) are all pointing higher. The intermediate trend (red line) is starting to weaken and roll over as the 10 week (50 day on daily) is starting to move lower after months of making new highs. The IWM remains in a massive sideways consolidation and a break of the the upper or lower channel will most likely determine the next move.


There is also plenty of evidence that shows the strong move from the beginning of the year will continue. Even though we had a tough September and broke a streak of 7 straight up months there remains some strong data that suggests the uptrend will live on. Below are two studies that back this up.
Ryan Detrick's
recent tweet shows how the S&P was up 6 quarters in a row. The next quarter has been lower only once and incredibly, two quarters later, stocks have never been lower. The average move a year later is +15.5% and yet another clue we are in a secular bull market and the surprise will be to the upside.
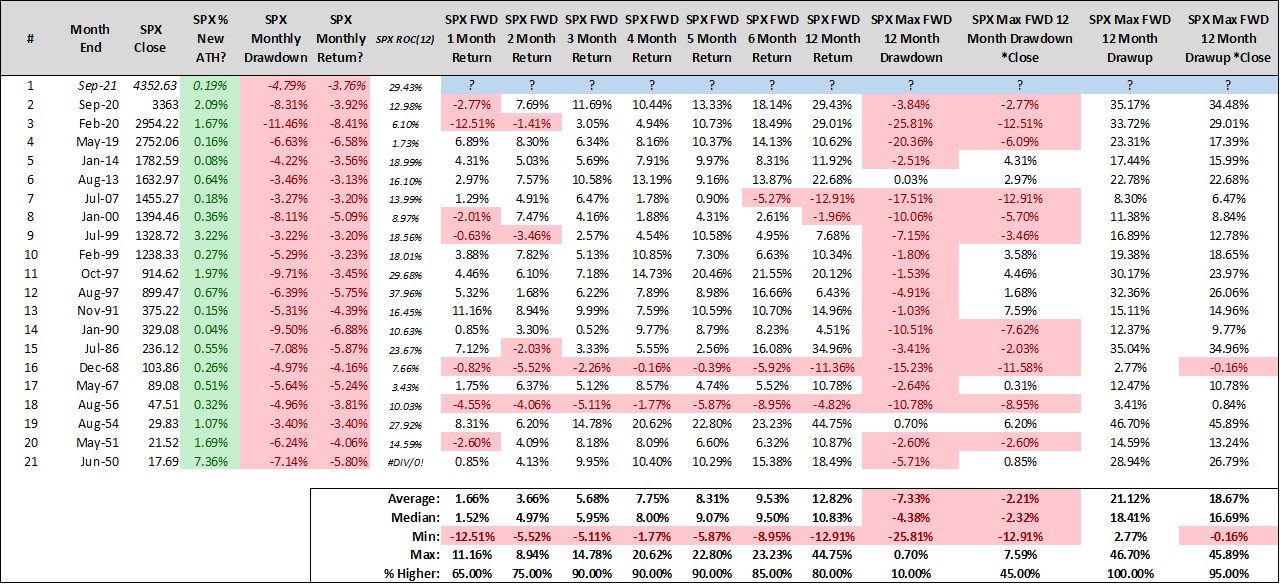
The tweet from
Steve Deppe shows how a weak September from a new all time high actually leads to strong returns.

Now as growth investors we are more concerned with that sector and momentum than other areas. But the data above confirms our bias that we remain in a secular bull. However, all is not rosy and the charts below have dampened our enthusiasm. We have been using the Ark funds as a proxy for the high growth and speculative areas of the market. They had a massive run the last few years and reminiscent of the late nineties. When an asset class has massive out-performance we are always aware of the potential for a hard snap back. So we started studying prior moves of excess and the following collapse. Low and behold from a pattern perspective the current set up in the ARKK ETF is very similar to the Nasdaq in 2000. After a massive up move in 2020, ARKK has underwhelmed so far in 2021. A big sell off from the peak in February has left it in a downtrend with all of the major moving averages turning lower. Does the next move set up a second leg down like 2000 or is it set for a bounce? I don't know the answer but the similarities in patterns and timing is enough to pique our interest and something we'll be following.
Nasdaq March 2000:
Tech collapse and subsequent bear market:
As growth has struggle since mid February we have been hesitant to put too much risk capital to work and be aggressive. We remain cautious and neutral and are willing to be patient waiting for the next opportunity to present itself. Until then we'll continue to monitor conditions and adjust accordingly.


