Wednesday, January 31, 2018

A blistering start to the year. Now what?

Global and domestic equities have started off 2018 on a blistering pace to the upside continuing the strong uptrend from 2017.   The idea that the new year would usher in tax selling after big gains last year couldn't be more opposite.  Instead, it seems as if money has poured into equity funds in a fear of missing out trade.  This market is being labeled a melt up market and frothy.  While short term indicators show that US equities are overbought we continue to think that the secular bull market remains the dominant trend and there is plenty more to come.  However, that doesn't mean we should not expect heightened volatility and periods of shakeouts and draw-downs.  We assume they will occur and the move in volatility this month is a testament to that theory.  In fact, this January hit another new record as it was the first time that the S&P 500 and the VIX both hit a new 10 day high at the same time. Below looks at how the VIX and S&P have become more correlated and trended higher throughout January.  

Lets take a look at the February Data:
  • Last 20 years: February ranks eighth in monthly performance with an average loss of 0.02%
  • Last 20 years: The average daily trend is choppy and trend-less
  • Last 20 years: February is the forth most volatile month 
  • Since 1950: February ranks ninth in monthly performance with an average gain of 0.10%
  • Since 1950:  February is the 9th most volatile month and is higher 56% of the time
  • Since 1950:  January is tied with July with the most 5% or greater monthly gains


We want to see what the S&P did for February, full year, and the rest of the year after gaining more than 5% in January.  The sample size is small with only 12 prior instances going back to 1950 but still paints a rosy picture for 2018.  We took it a step further in the second study looking for prior instances of a 5% or greater January and the prior month hit a new high  Even smaller sample size but still remains bullish.  


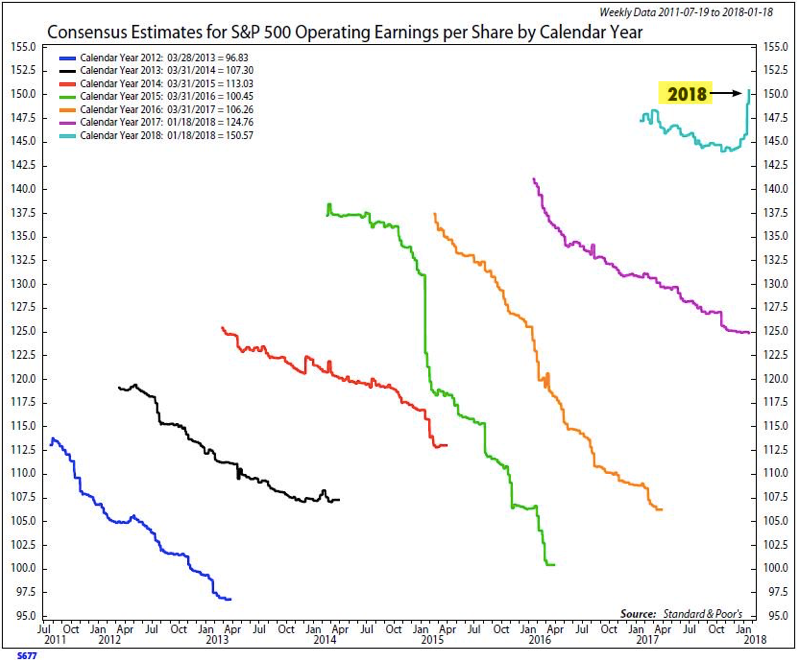
One of the main reasons driving this bull market is that we are going from a QE market to an earnings driven market.  This is the first time in a while that earnings revisions are actually be raised rather then revised downward throughout the year (from NDR). 


There is a legitimate concern about the rise in rates and rightfully so.  However, we looked at the data when the S&P was up more than 5% and the TNX (10 yr yields) are up greater than 10% just like this January and we find that the returns in the S&P remain favorable to the bulls going out 1,2,3, and 6 months.  Are the rise in rates signaling a better economy?  We think so, and also believe that rates will have to be much higher before they become a big problem.  There was only one prior instance of January gaining more than 5% and TNX gaining more than 10%.  That was in January 2013. 


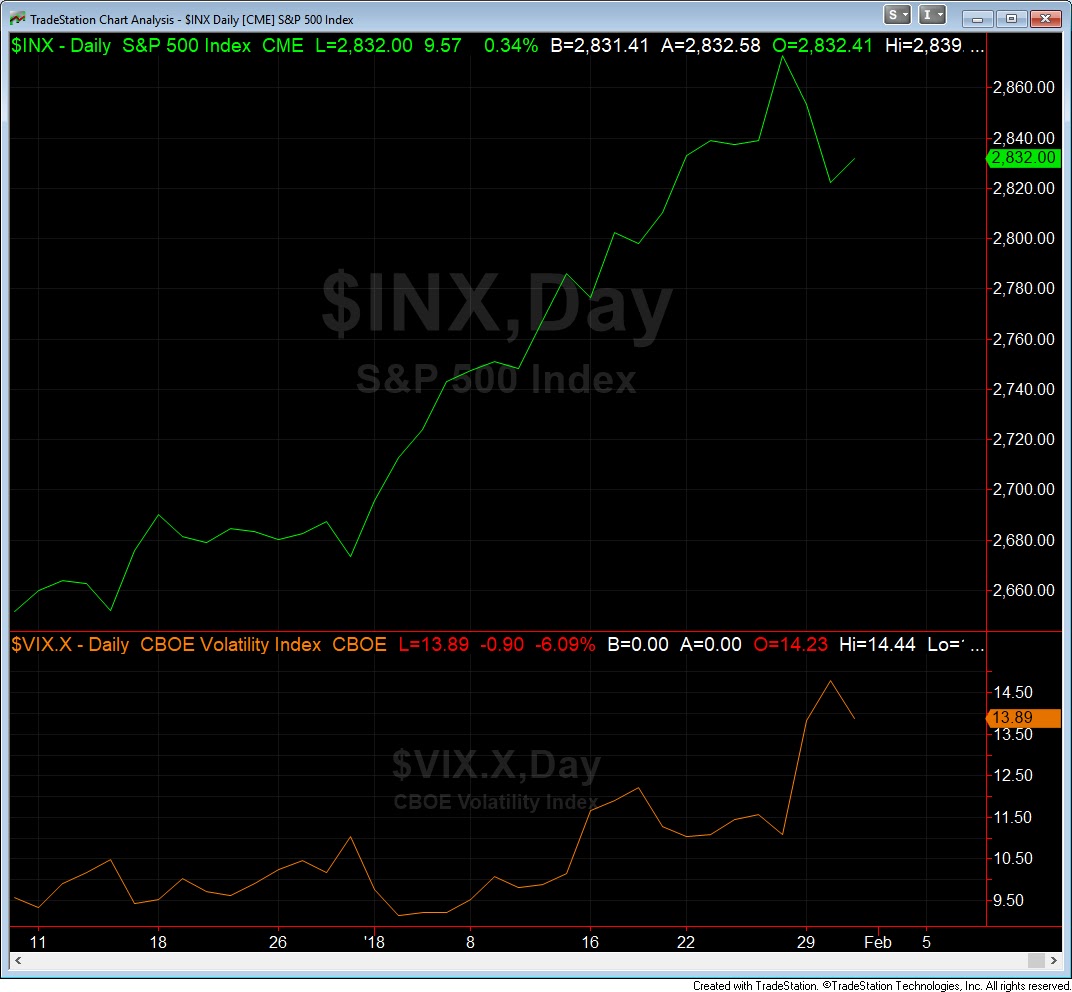
The 3 major averages all broke their steep up trend-line from the January lows on Tuesday.  This simple 1% down day, which was the first one in 112 days, caused traders to panic and it seems as if sentiment went from overly optimistic to extremely bearish in one day.   The CNN fear and greed index sits at 61 as it pulls back from extreme greed at the same time the put call ratio spiked along with the VIX.  Yet, the S&P broke the record for number of days without a 5% correction this month.  The US equity markets have started the year off on a hot start.  We don't expect the same bullishness every month this year but the stats favor another strong year.  Even though we remain bullish longer term we expect bouts of volatility to increase throughout the year and having a tactical view will prove to be prudent. 

Wednesday, January 17, 2018

Plenty of bulls

The dominant trend of global equities remains higher and has accelerated to the upside to begin the year.   A handful of indicators are flashing frothy levels in the short term but the first few weeks of the New Year also ushered in an increase in breadth as momentum accompanied new price highs.  Today's reversal after the large gap up could signal that we are due for some weakness in the near future.  The data and sentiment suggest that we are overdue for some give back after the torrid pace set in the first few trading weeks of the year.  In the first two charts below we look at how breadth has expanded in the form of new 52-week highs and the % of stocks trading above their 50 & 200 day moving averages.  Both indicators are expanding as the indexes make new highs.  The last chart shows how the S&P remains overbought based on the 14 period RSI.  If we look at examples from last year's bull run, when the RSI reached extremes, the market tended to consolidate once it reach these levels.  Steve Deppe sums up what the data looks like after yesterday's one-day outside reversal from 52-week highs while volatility is also rallying.  


Sentiment and position presented in the monthly BAML survey gives us a glimpse into fund managers perspective on the global investing landscape.  The viewpoints documented in the monthly survey gives us the ability to look at a potential contrarian outlook to shape trades against the herd.  January's data has plenty of trends to observe and below we address the more notable takeaways. 

January rotation shows a buying of cyclical plays and selling of defensive plays.

Net hedge fund equity market exposure jumps to 49% which is the highest since 2006.

A majority of investors now expect a peak in equity markets in 2019 or beyond, pushing back the timing by two quarters from December, when the majority expected a top in Q2 2018.


Investors overweight allocation to equities relative to overweight bonds highest since August 2014.


Allocation to equities jumped to 2-year highs of net 55% overweight.  Current allocation is high at 1.1 stdev above its long-term average.


Allocation to US equities slips to net 17% underweight from net 15% underweight last month while allocation to Eurozone equities holds a net 45% overweight remaining elevated vs history. 


In conclusion, the trend remains up as all US equity indices hit a new high yesterday.  However, with the reversal off new highs on healthy volume after the current thrust higher over the last week, we expect volatility to pick up.  Coupled with the excessive sentiment and the aggressive positioning in equities from managers we are watchful for any pending weakness.   From a contrarian trade it seems as the herd is positioned for continued strength with little worry of the market peaking.  Considering how fund managers are deploying their capital the biggest shock would be a market top in the first quarter and a real correction during 2018.  We still believe the market is healthy and short term pullbacks should be expected.  We view these potential pullbacks as opportunities and still favor US equities as they remain underweight versus their European counterparts.