Wednesday, September 24, 2014

Observations on the Russell 2000


We're big believers in agenda-free investing.  It's important that investors be aware of their biases and avoid "forcing" trades because of them.  When we look at data and trends, we're hoping to determine the potential scenarios the market is offering us while not becoming married to any single prediction/outcome.  Yet from those scenarios, we believe we can make more informed decisions and better define our risk when making our next directional trade.

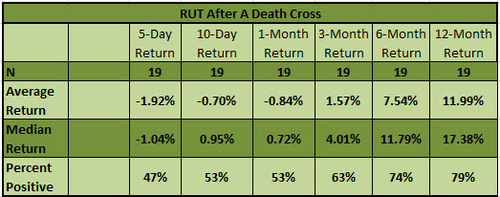
With all the talk on divergences and death crosses, I wanted to touch on the recent weakness in the Russell 2k and some observations.  The death cross (50 day moving average crossing below the 200 day moving average) that is happening in the IWM lacks a clear historical edge to the downside.  This can be seen with the useful study shown below (from Ryan Detrick Russell 2k Death Cross).  We can see that while near-term returns skew to the downside, intermediate (3-month to 1-year) performance is meaningfully positive the majority of the time.

image

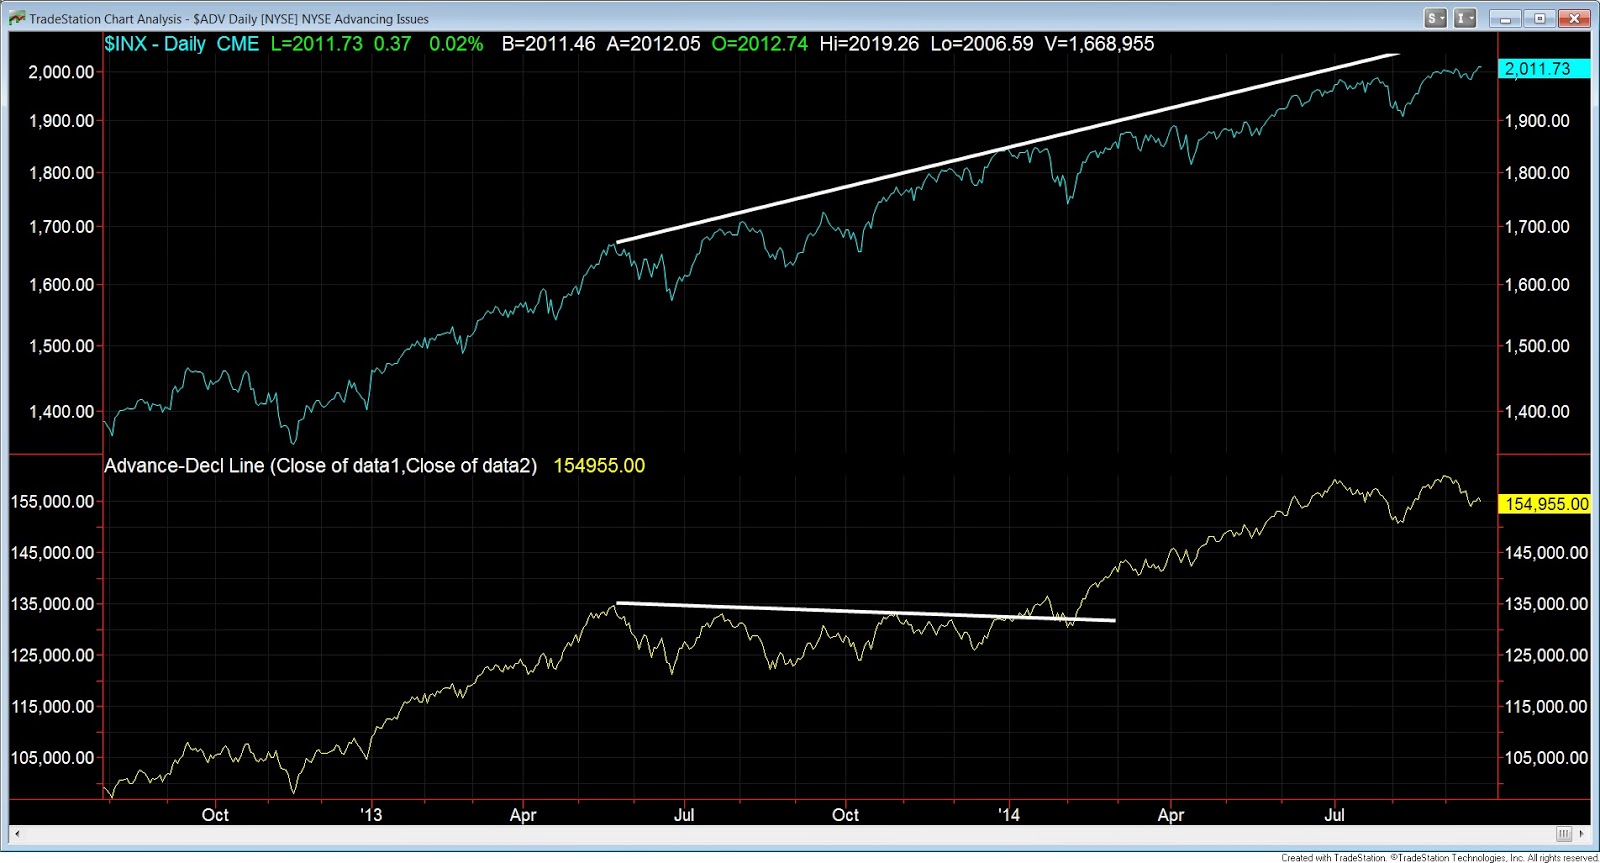
However, what worries us is the clear divergence between small caps and large caps.  The folks at Nautilus Research (@NautilusCap) help sum this up with the data shown below.  It looks at the instances where the S&P has proceeded to climb (up > 5% in a 6 month period) while the Russell is retreating on a relative basis (RTY/SPX Declines > 10% over the same 6 month period).  To summarize, the data portends to the Russell and the S&P struggling over the next couple of months and considerably underperforming relative to their historical trajectories.

Embedded image permalink

Lastly, in our quest to keep it simple, a long term price chart of the IWM is what concerns us most.  If this long term up trend-line breaks to the downside we could be in for more pain and a much larger correction.  Since the beginning of the bull market in 2009, this trend-line had only been touched twice prior to this year (October 2011), (November 2012).  In 2014 alone we have tested this significant support 3 times.  This is something we are watching closely and its resolution will assist in understanding the scenarios the market is currently offering.


Monday, September 22, 2014

More on Divergences


Research from Lowry's states "The Advance-Decline Line has been a very important tool in measuring the forces of Supply and Demand at work in the stock markets for more than 80 years. In fact, of the fifteen major bear markets (defined as those generating losses of -20% or more) occurring in the 80 years between September 1929 and March 2009, thirteen of the fifteen cases (86.7%) were preceded by several months of significant negative divergence between the Dow Jones Industrial Average and the NYSE Advance-Decline."

The challenge with this type of research is that only in hindsight does it make perfect sense.  In real-time, however, it becomes an entirely different exercise.  Case in point take the take the 1973 top in the DOW in which the market then tumbled close to 47% until the December 1974 bottom.  The A-D line topped out in mid-1971, just about a year and a half before the Dow put in its high. 
Charts from Tradestation
Based on the numbers a negative divergence in the AD line gives a high probability of a market top (86.7%).  However breadth divergences can just as easily resolve to the upside.  A good example is the recent action in the S&P.  We had a divergence in the A-D line vs price highs in the S&P for over 6 months (6/13-1/14).  However, the S&P never corrected and the A-D line eventually made new highs along with the general markets.  


What is difficult is trying to use this data as a timing device as divergences between breadth and price can last months and in some cases years.  However it doesn't mean they are useless.  Its just part of the process to shape the direction of the market and keep the possibility of a top in mind.....

What is useful to know is that almost 87% of all major tops have showed this divergence.  So if and when we do get a top perhaps this will have been one of the market's "tells".  Along those lines, the Nasdaq is currently showing a major divergence.  Only time will tell.  


Friday, September 19, 2014

Divergences - What are they telling us?

As mentioned in our first post, we're big believers in the KISS philosophy.  Keep It Simple Stupid.  Within that framework, we are in constant search of the most relevant information available to both support and, more importantly, challenge our investment decisions.

We look at a ton of data.  And we can look at it until we're blue in the face but quite frankly unless we're processing that data properly and fairly, we run the risk of using it to confirm any biases we may be carrying.  It's impossible to have a perfect record in this regard but it's something we constantly challenge each other to manage.

The massive divergences taking place in the markets have brought about a flood of charts and articles across our desks lately.  Concerns over breadth and leadership seem to have everyone positioned with one foot already out the door.  One of our favorite resources, Dr. Brett Steenbarger's Traderfeed blog, touched on this topic on Wednesday (Breadth Weakening) and one could certainly allow the story told in these data points to dictate the posture of their portfolio.

Yet for all the negative divergence warnings we've been seeing, here's one we see as a potential major positive.  After some recent periods of weakness are financials about to lead the market?  Over the last month the strongest sectors have been brokers, banks, regional banks, and financials (chart by Telechart).  The relative strength of the XLF vs the S&P 500 is breaking out to 3-month highs.


This is in conjunction with the rise in yields.   We'll be watching this action closely as money appears to be aggressively rotating into these sectors.  To make things even more confusing, Financials leadership has historically been more characteristic of an early stage bull.

As always, the market seems far more interested in making us look stupid rather than helping us keep it simple....

http://www.ritholtz.com/blog/wp-content/uploads/2011/02/Sector-Rotation.png

Thursday, September 18, 2014

Welcome

Hello!  Welcome to the Worch Capital blog and our first post! Thank you for stopping by today.  Hopefully, over time, the site becomes a daily "must see" for you.  

Our goal is to create an engaging, thought-provoking and collegial environment that can serve as a daily resource in the effort to make sense of the markets.

We batted the blog idea around for months debating whether or not we could fill the space with enough worthwhile content.  Ultimately, we decided we could and thought the project might be a great way to document the daily "spitballing" that goes on here in the office.

You can read more about us and the firm in the "About" tab but here's what you need to know:  We're not trying to re-invent the wheel when it comes to investing.  We use tried and true methods when observing the market and most definitely subscribe to the K.I.S.S. philosophy.  We are not here to talk our book or convince anyone to mimic our methodologies.  We believe there are infinite ways to make money in the market and no one strategy trumps all others.  Although, we strongly believe that success in investing is found in finding a strategy that suits your own personality and staying extremely disciplined.  With that in mind, we intend to share our insights on a wide range of market-related topics (broad market/industry observations, individual stock price action, quantitative analysis, risk management, fundamental and technical analysis, trade management, etc) and some current event and pop culture commentary when the mood strikes us.

This is most definitely a learning exercise for us and surely there will be bumps along the way.  We don't know what it will look like or where it will end up but if we get even a little bit smarter and/or meet a few new friends, it will be time well spent.

Let's keep it agenda-free and light.  And with that out of the way, here we go....We look forward to your contributions and feedback.