Tuesday, November 14, 2017

November Fund Manager Survey

Over the past few blogs we have looked at why the market could be due for a pullback.  Outside of the Russell 2k the majority of the big indexes have lugged higher with a persistently strong trend.  As we enter the historically strongest 3-month period in the market and with the potential for tax reform on the horizon we remain bullish till year end.  What we found interesting in the monthly data is that if we only looked at the last 20 years the trends change.  This certainly has a lot to do with the 2 major bear markets we have experienced but nonetheless the findings are intriguing.  Especially the weakness in January the last 20 years versus the larger time period.  Considering the strength of the market this year it would make sense to push off selling winners until 2018 especially if tax reform is accomplished.  This could bring in some volatility in the beginning of the new year.  Below we look at the monthly performance of the S&P 500 going back to 1950 and the most recent 20 year period.  Since 1950, the Nov-Jan period is the strongest 3-month period historically.  If we limit it to the last 20 years it ranks as the 5th strongest 3-month period, although November and December are very strong in both time frames.  This should bode well for a strong finish to year end. 


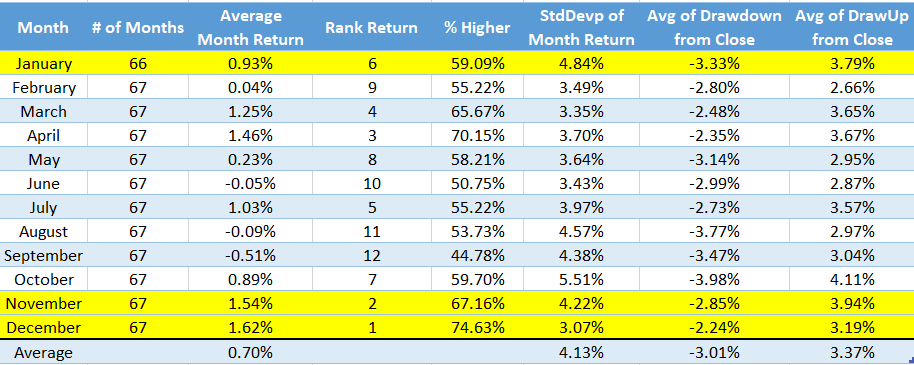
In our role of portfolio management we always want to play devils advocate and poke holes in our thesis so we don't turn a blind eye to potential pitfalls.  The data above certainly paints a bullish picture the next few months.  In our last blog on divergences we highlighted how momentum has peaked creating a negative divergence.   Below we look at the recent weakness in high yield and what that may forecast for the equity markets.  We can see in 2017 when high yield index has broken down this leads to a slow down in equity markets.  Is this time different?  We don't have the answer to that but it is something we continue to monitor. 


If we turn our attention to the monthly fund manager survey (FMS) from BAML, there are a some levels that are flashing a more cautious tone.  Below is a recap of the current month takeaways straight from the November report.
  • It’s frothy FAANG: big market conviction in Goldilocks (+ price action in FAANG/BAT,
    Bitcoin) leading to bull capitulation; FMS risk-taking hits all time high (Exhibit 1), cash
    decisively lower despite record high saying equities overvalued (= irrational
    exuberance)…our conviction in winter post-tax reform risk asset correction hardens
  • Consensilocks: all-time high Goldilocks expectations (56% expect “high growth, low
    inflation”); contrasts with tumbling bear view of secular stagnation as macro backdrop
    (was 88% Feb’16, now 25%); US tax reform expected to sustain or inflate Goldilocks
  • Ever closer to the sun: Nov FMS cash level drops to 4.4% from 4.7% = lowest since
    Oct’13 & no longer a “buy signal”; FMS hedge fund equity exposure at 11-year high;
    BofAML Bull & Bear Indicator up to 7.2 but sell-signal not yet triggered
  • Correction catalysts = inflation & market structure: biggest FMS risk to EPS =
    wage inflation; rising FMS concerns re “market structure” (3rd biggest tail risk);
    strategies most likely to exacerbate correction…vol selling (32%), ETFs (28%), risk parity
    (16%)
  • Notable FMS takeaways: crowded trades are #1 long Nasdaq, #2 short volatility, #3
    long credit; highest global equity OW since Apr’15, highest Japan OW in 2-years, an epic
    FMS UW in UK assets, and big Nov rotation to energy from bank stocks
  • Contrarian stagflation trades: long UK, short Eurozone; long pharma, short banks;
    long utilities, short tech
The first few charts should be grouped under opposite opinions.  There are a record number of managers taking higher than normal risk as hedge funds net equity exposure rises to an 11 year high of 47%.  In the same breadth those same fund managers say that equities remain at excess valuations but are putting cash to work with cash levels falling to 4.4%.  Our own opinions make us think that under-performing fund managers are willing to risk capital over the next few months to try and catch up to their benchmarks regardless of the stretched valuations presented.  From a global economic outlook the data remains favorable.  This is displayed in the fund managers expectations of the global economy in the next 12 months.  Expectations in the "Goldilocks" scenario (above-trend growth and below-trend inflation) rose 8ppt to 56% which is another record high.   


We'll leave you with one more data point we recently read that pique our interests.  Jason Goepfert from Sentiment trader wrote this last night:

The S&P’s split personality.  Last week, there were a lot of buying climaxes (reversals from 52-week highs) in S&P 500 stocks - 32 of them, which was up from 20 the prior week. There were also a lot of selling climaxes (reversals from 52-week lows), 17 of them, which is highly unusual in a week when there were so many buying climaxes. Usually there are many of one or the other, not both. The only time we’ve seen so many of both kinds of reversals, showing a highly split market, was in March 2000.

Once again we have presented alternative view points for both bulls and bears to consume.  We remain firmly in the bullish camp as we continue to operate within our secular bull market assumption.  However with some negative divergences appearing along with some inflated conditions to the upside we have some cash on the sidelines to put to work on any weakness as we look for a strong close to year end. 

We hope everyone has a safe and wonderful Thanksgiving!  We certainly are thankful over at Worch Capital for all blessings we have. 
 

Tuesday, November 7, 2017

New highs but signs of divergences

The market indices continue to chug along as they steadily make daily new highs with the exception of small caps which have lagged recently.   We have not touched on correlations of late but this has proven to be the year of stock picking.  During most of the QE environment from the market bottom in 2009 correlations remained abnormally high as asset classes and sectors followed each other in the same direction in a herd mentality fashion.  However sector correlations have completely diverged throughout 2017 and are hitting the lowest levels by a wide margin.  Below we look at the 30-day average correlations of the major S&P 500 sectors.  We overlaid the trend of the S&P 500 during the same time frame.  It clearly illustrates how 2017 has been a stock pickers year as correlations have collapsed.  We believe this is another endorsement for active management going forward.


Below is a great blog post from Chris Kimble that highlights the divergence in equal and market capitalization indexes.   This shows how a few big cap stocks (think FANG stocks) that have performed well are propping up the indices.  The equal weighted indexes are under-performing the cap weighted indexes by a whopping 25%.  We also see this divergence in our own breadth indicators.  One simple one we follow is the amount of stocks trading above the 20 and 50 day moving averages.  The second chart shows how momentum has peaked prior to price displaying a negative divergence.  This usually is resolved to the upside but we can see typically when momentum fades this tends to lead to a level of consolidation or pullback before breadth picks up and momentum resumes. 


The S&P remains overbought and with momentum fading we could be in for some short term weakness as the market digests the recent gains.  However, as earnings season had been favorable to equities and with the potential for tax reform this should keep a bid in the market.  Coupled with correlations at multi-year lows this sets up nicely for an active manager assuming you are positioned in the right areas, as we think the strong will get stronger and the weak performers will be under tax selling till year end.