Wednesday, October 18, 2017

Are we due for a pullback?

This is a question we are constantly asked and one we find the hardest to answer.  If we knew every time the market was going to pullback we wouldn't be writing this blog, instead we would be counting our dollars.  What we attempt to do is weigh the evidence presented and trust our research while making educated bets.  We wanted to start with a simple picture of the current landscape and move on from there.

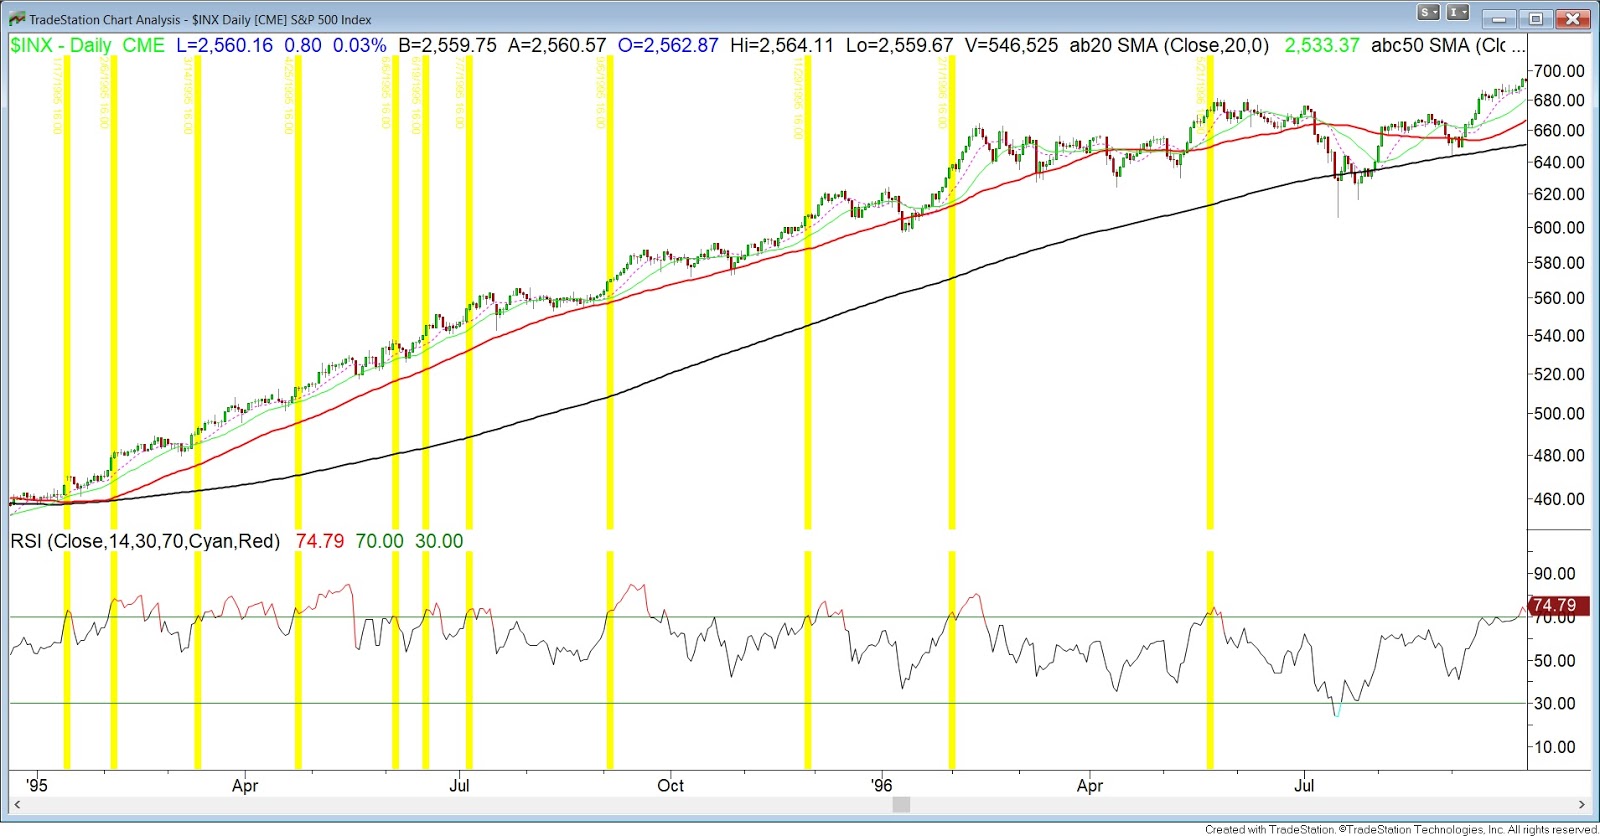
Below is a chart of the S&P with a simple 14 day RSI.  We know from historical data that an overbought RSI doesn't necessarily mean we are due for weakness.   In some instances it is forecasting future strength and in other cases it anticipates potential pitfalls.  The data going back to 1960 shows no statistical edge going out a few weeks or months trying to predict an overbought RSI.  In previous posts we have referred to prior strong trending years for comparison purposes.  We still believe these to be true and why we are highlighting this below.  1995 was one of the strongest trending years in recent past and we can see that the RSI stayed overbought for much of the year while the S&P trended higher.  The 2013-14 market had multiple instances of an overbought RSI all the while the market trended higher for months.  This year is shaping up much in the same fashion as these two years.  What we have noticed is that in most cases when the 14-day RSI became overbought the S&P went on to consolidate or pullback in the near future.  As with any indicator it is not full proof but it is something that we watch and heightened our risk metrics. 


Next we wonder if the S&P has broken out to the upside from its 12 month ascending wedge pattern.  The path of least resistance is higher and if we do get a pullback we'll be watching the top of that channel for support.  What we don't want to see is a hard sell off back into the range causing a failed upside breakout.  This could lead to a longer consolidation. 


Another useful tool is the monthly fund manager survey (FMS) from BAML.  It always offers an interesting view on the global investing landscape and is a good barometer of current market sentiment.  Below are the key takeaways that we focused on. 

One data point that backs up the case for a potential pullback is that global equity overweight suggests risks ahead for stocks.  With global equity net overweight now at +45% this has historically coincided with equity underperformance versus bonds & cash over the next 3 months.  


Fund managers are positioning themselves for higher rates as just 3% of investors think global bonds will be lower in the next 12 months.  82% say bond yields will rise and a record 85% say bonds are overvalued.  The rotation into banks (biggest in 3 years) and Japan while selling utilities, emerging markets, healthcare, and bonds is evidence managers expect higher yields ahead. 


Cash has fallen to 4.7% but still remains high as this is a catalyst for shallow pullbacks.  Managers are waiting for any dip to put cash to work. 


Through all of our research we continue to conclude the general markets remain in a secular bull market.  One of our thesis was the strong backdrop of our economy coupled with growth in earnings is what is propelling equity markets higher.  Below supports our opinion as the expectation for macro "Goldilocks" (above-trend growth, below-trend inflation) is at record highs.  It is the first time since March 2011 this exceeds investor belief in below-trend growth & inflation as the driver of financial markets. 


In summary with the current overbought conditions along with global equity overweight we are mindful for a potential pullback/consolidation at any moment.  Yet with cash levels still high to support dip buyers and a stable and growing economy the bull market is alive and well.  To strengthen the bull case we are entering a seasonably strong period in the market that we discussed in our last blog.  With earnings season upon us, we'll be looking to put cash to work in fresh new ideas but not chasing strength blindly considering the current outlook. 


Wednesday, October 4, 2017

A look to the 4th Quarter

Looking at October data:

  • Last 20 years: October ranks second in monthly performance with an average gain of 1.86%
  • Last 20 years: The average daily trend starts slow and finishes strong
  • Last 20 years: October is the most volatile month 
  • Since 1950: October ranks 7th in monthly performance with an average gain of 0.89%
  • Since 1950:  October still is the most volatile month yet is higher almost 60% of the time
  • Since 1950:  If the S&P is up greater than 10% for the year, September was positive, and September hit a new high, the average return for the October-December period is 6.39% (9 prior instances)


We have a lot of data to sort through to shape a thesis heading into the fourth quarter.   Clearly there is a bias to the upside as Q4 is historically the strongest quarter by far with an average gain of roughly 4% and higher 79.1% of the time.  Also since 1950, the October to December 3-month rolling average is the second best streak only behind the very favorable Nov-Jan period.  A nice stat courtesy of  Steve Deppe via Wayne Whaley states:

"The S&P has been positive in each of the last six months.  Since 1950, there have been 19 previous occasions of a down month and then six consecutive positive months and in all 19 of those setups, the S&P was higher either six of twelve months later, suggesting per this one study, that the odds of a Bear Market in the next 12 months is small."

To throw a wet blanket on all the good data, if we look at how the average October fares after a solid start to the year we get some conflicting signals.  We wanted to see how October returns looked when the S&P was up greater than 10% year-to-date and September was positive which are the exact conditions heading into this October.  The average monthly return for October is a loss of -0.78%.  If we add that September made a new all-time high then October returns 0.33% which is well below the average October from the stats above.  However, it finishes strong with a gain of another 6.39% for the rest of the year.

So how do we use this data to position our portfolios?  The quantitative data from a seasonality point of view is just one in many data points that goes into our overall thinking but it certainly helps to frame an outlook.  Let's take a look at some other measures;

The healthy uptrend remains as all four of the big US indexes are above their respective 20, 50, and 200-day moving averages and all are at new highs.  In an impressive show of resilience, the S&P has been up 10 out of 11 months on a price only basis.  It doesn't get much stronger than this from a trending perspective.  If we narrow down to the 10 major sectors, 8 out of 10 reside above their 20, 50, and 200-day moving averages.  We also track 9 foreign indexes and all are above their 200-day while the majority are above the 20 and 50-day moving averages.  Equity markets across the globe are trending higher.


Breadth in the form of participation is also very healthy.  The Russell 2000 has made the biggest jump in the last month as now almost 80% of issues are trading above their 50-day moving averages.  The second chart below shows new lows across all markets have dried up while new 52-week highs are starting to accelerate.  The advance-decline line is also making new highs confirming the strong breadth of this market.  One area that concerns us on a shorter-term basis is the market entering overbought territory.  The RSI (last chart bottom panel) is reaching levels that have previously caused some stalling action in the S&P during the run up since summer 2016.


Leadership has seen a rotation in the last few weeks as small caps and value have broken their underperformance as new money has positioned in these areas.  The chart below compares growth vs value and the up-trend from the beginning of the year is now broken.  This is something we'll be watching closely in the 4th quarter.


While the AAII Index remains in neutral territory the CNN fear and greed index's is flashing warning signals as it now stands firmly in overbought levels at extreme greed.  This is way up from neutral one month ago.


Lastly we look at volatility.  We now know that October is historically the most volatile month.  However, according to our September stats blog we found that September was the second most volatile month in the last 20 years.  If you follow stats blindly without taking into context the whole picture that statistic didn't help out too much.  In fact, last month was the least volatile September ever recorded.

In summary, as we head into the fourth quarter we firmly believe in following the path of least resistance as the strength and momentum in this market could carry us to the end of the year.  The prospect of tax reform getting done has continued to keep a bid in the market.  Nonetheless, with elevated levels of sentiment and overbought conditions coupled with the historic volatility of October, we will keep some opportunistic cash sidelined as we enter earnings season.  Outside of tech, we are seeing opportunities developing within the current rotation into banks, small caps, and the energy complex.