Tuesday, November 8, 2022

Markets, elections, and money flows

Today voters across the country go into the booth to cast their ballots for the midterm elections. We have a ton on statistical data on the markets during such events. Will the outcome change the direction of markets? We really don't know the answer but I would think based on betting odds it looks like we'll have a divided government. Below are the current odds for the house and senate from electionbettingodds.com.


A divided government is favorable for  market returns and could be one of the reasons for the recent rally off the lows. Below shows the market returns under different leadership since 1977. 


On top of that we are in a seasonably favorable time for market returns. Below is a study from Wayne Whaley. Since 1950 the S&P has never closed lower from the November of a midterm election year through April of a pre-election year while averaging 15% returns. 

Ryan Detrick shows a similar outcome but also how weak markets tend to behave heading into a mid-term election. "The average midterm year since 1950 corrected 17.1% on average, the most out of the four-year presidential cycle. That’s the bad news, the good news is stocks gained 32.3% on average a year off those lows and have never been lower. Although we don’t know if October 12 is officially the low or not (but we think it very well could be), there could be a lot of opportunity for bulls over the coming year."


The statistical data certainly favors the bulls. However, what has us most concerned are the fundamentals and money flows. We have yet to see see numbers drastically cut or a panic in sentiment. The VIX continues to languish showing no real fear. 

Prior market bottoms coincided with a capitulation in equity flows. We are not there yet. 


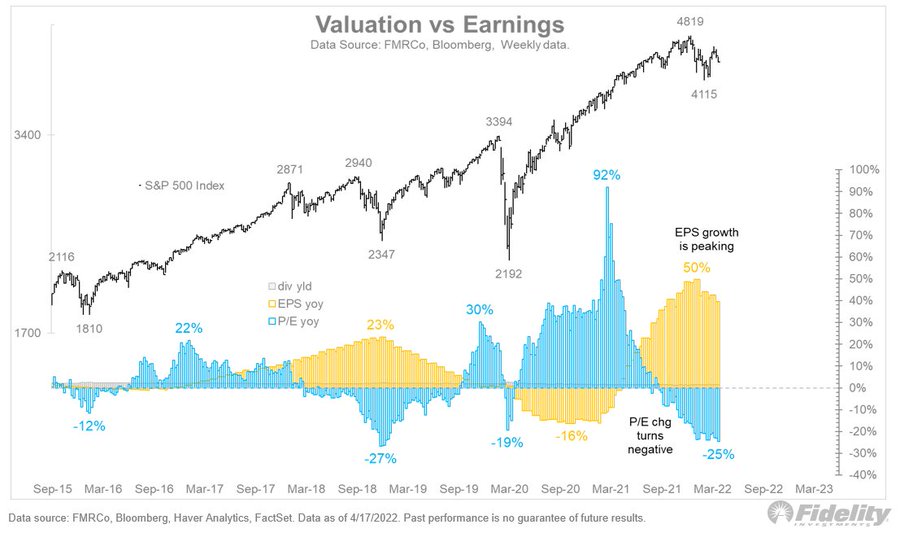
As of the end of October the average consensus among wall street analyst is for S&P earnings to grow 7.3% in 2023. However, some analyst are starting to cut their estimates as Goldman just did citing margin headwinds next year. BofA says S&P 500 earnings estimates for 2023 take complete U-turn as recession risks loom. What if we get a recession in 2023 and current estimates are way too high. Below is how much S&P earnings have retreated in each of the prior 11 US recessions. 

If current 2023 estimates are $233 for S&P 500 what happens if they are drastically cut. Below are some scenarios depending on the magnitude of decline in 2023. With current year estimates now around $220 for 2022:

Decline          EPS estimate

5%                 $209

10%               $198

15%               $187

20%               $176

The forward 12-month P/E ratio for the S&P 500 is 16.1. This P/E ratio is below the 5-year average
(18.5) and below the 10-year average (17.1). If the S&P trades on a 10-year average for 17.1 times next year earnings based on lowered guidance where does that put the market?


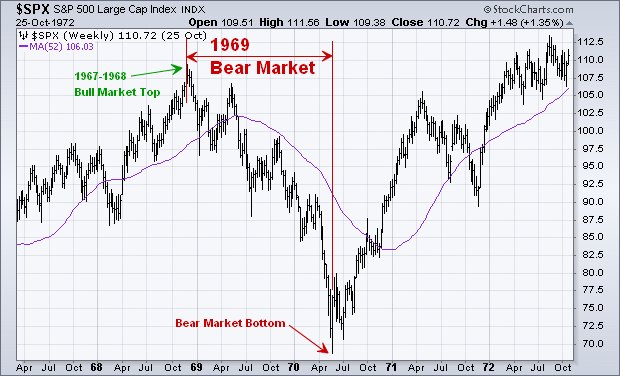
Lastly, we continue to like the historical analog Jurrien Timmer at Fidelity has shown with the similarities to the 1946-49 market. "Then, as now, stock prices reflected the impact and then hangover of major fiscal/monetary impulse. If the analog holds, we could be in the process of another 15% counter-trend rally followed by another retest of lows."

Once again there is something for both the bulls and bears. We try not to get too invested in one side or another and rather react to market trends and conditions. Our best guess is the next few months won't be an easy one either way with lots of confusion and choppy/volatile markets. The 1946-1949 analog would really frustrate the masses. Will be watching inflation data, rates, and the US dollar for any clues as these have been the driver of market returns the last year or so.


Wednesday, August 17, 2022

Is the bear market over?

We would love to know the answer to this question also. Unfortunately, we won't ultimately know until hindsight sets in. How do we try and decide in real time though? The best course of action is to look at what the current data tells us and try to put the probabilities in our favor. Has the character of the market changed and is there evidence that the bear is behind us? Nothing is certain in trading, but to create an edge we need to put the odds on our side. Lets get into it.

Below is a list of all bear market rallies from Milton Berg since 1973. Just one bear market both lasted longer than 37 days and gained more than +14.82%.

For the first time since the Nasdaq topped late last year, the MACD has turned positive during the current rally. 


Based on 12 studies on market breadth done by Chris Ciovacco in his weekly market update, the odds are heavily in favor of the bottom being put in. Based on 61 signals over 12 studies, the low was made in 93.4% of cases. Which means there is a 6.6% chance the market can still make a lower low. 

Below is a daily chart of the Nasdaq with the percentage of extension above or below the 50 day. We recently hit levels only hit 3 other times in the last 20 years. 2 out of 3 ended a prior bear market. The 2000 rally was a bear market rally that eventually rolled over.


Another measure of breadth thrust from Jonathan Harrier is favorable to the bulls over the next 12 months. 


Yet, this tweet thread from Jurrien Timmer explains why it is so hard to spot the difference between a bull market and a bear-market rally. If we look at data going back to early 1900s, breadth advances are associated with new bull markets and bear market rallies.  

Breadth readings during new bull markets:

Bear market rallies:


The current rally in the S&P has retraced 50% of its losses from peak to trough. As Jurrien states, "So, on a historical basis, if this rally advances much further, it will be hard to conclude that this is not a new bull market. This is one of the few technical clues out there. If this is a bear-market rally, it likely has gone as far as it will go."

Below is a chart from Ned Davis comparing bear markets depending on whether or not a recession occurred. 

One way we gauge sentiment is the monthly BofA fund manager survey. Below are the key takeaways from the most recent month.


  Cash still remains elevated showing the wall of worry traders still have. 


From a contrarian perspective the % of investors that think the global economy will experience a recession in the next 12 months is the highest since May 2020. The prior peaks were good buying opportunities. 

If we avoid an earnings-led recession but continue to have a valuation reset the outcomes are very different. This is the price analog from Jurrien Timmer that was discussed in our last blog and remains an interesting guide post. 

The evidence favors a market that has bottomed and will continue to climb the wall of worry and rally higher. The wild card remains if we get a bigger and nastier recession and this is nothing more than an extended bear market rally within the context of a longer bear market. A third scenario remains, in which the market has bottomed but finds itself trend-less for an extended period before resuming higher. Even with all the data presented it still remains difficult calling this a new bull market or a bear market rally. At the end of the day we really won't know until it's over what type of bear market this will end up being. What matters most is the price action and right now it favors a strong rally. When the evidence and facts change we will adjust accordingly.


Thursday, June 9, 2022

Recession or rally?

In this post I will breakdown why the market could have both a recession and a rally all while remaining in a challenging market for longer than expected. The S&P is currently in a 5 month bear market that started in January of this year. However, many speculative areas have been in a bear market for 12 months or longer. ARKK, XBI, spacs, and meme stocks all peaked in early 2021 and are down 60-90% from their peak. Below is a chart from Jurrien Timmer showing all bear markets and serious corrections since 1871. 


Lets get right into the data.

A tweet from Liz Ann Sonders shows the probability of a U.S. recession (based on the 2s10s yield curve per @Economics) has risen to the highest since February 2007


This tweet from Jim Bianco is dated but still relative as oil continues to rise. Not every recession is led by a 50% rise in crude but every 50% rise in crude has led a recession. 


Charlie Bilello takes a look at consumers balance sheets and it doesn't paint a pretty picture. Americans savings rate is the lowest since 2008 while their borrowing has seen the largest increase since 2011. 

JP Morgan CEO Jamie Dimon piles on the bearish case in his most recent comments as he is calling for the potential of storm clouds to turn into a full blown hurricane. 


Even with all the bleak data counter trend rallies are a common trait of bear markets. Below is a chart from Nautilus Cap showing all the 5% counter trend rallies during the 2000 bear market. 


Some positive news and maybe why this market is poised to rally.  Ryan Detrick displays all the corrections in the S&P 500 since WWII. The average correction takes 133 days to bottom. The recent 18.7% correction bottomed in 137 days. 


By far one of the best comparison charts is the recent tweet from Jurrien Timmer. He outlays how the current environment mirrors the patterns from the late 1940s. However there is a big issue the current market is dealing with in regards to valuation, earnings estimates, and cost of capital.


There is a lot of data to back up the recession debate. My guess is just as good or bad as they next pundit whether the market goes into a recession or not. But we do know some historical precedent that can help guide our thesis and positioning. What the data does show is the rapid rise in oil is usually a problem for the economy. We also know that recessionary bear markets are historically longer and deeper than non-recession bear markets. The average forward P/E for the last 10 years is 16.9. During a correction that ratio has gotten as low as 13 during the 2020 pandemic lows. Even after the recent contraction in the forward price/earnings valuation for the S&P (from 23x to 16x), at 17.4x, the current market is only fairly priced and not historically cheap which is associated with bear market bottoms. If the S&P traded to a reasonable 15 P/E based on forward estimates it would sit at 3600. That would equate to another 12.5% downside from here. 


As Jurrien put it, "perhaps sideways is the new up, and we remain stuck in a long trading range, just like the 1940's analog." Considering most new traders in the last decade are used to buying every dip to watch markets race back to new highs, it is conceivable to have an extended chop fest to confuse the masses and hit the ultimate uncle point. Part of being a good investor is being flexible and aware of multiple scenarios.


Wednesday, April 27, 2022

When will this market bottom?

Make no mistake, the markets are in a bear market. The technical definition of a bear market is a decline of 20% from the highs. We primarily track four major market indices to get a pulse of the investing landscape. They include the S&P 500, Dow Jones Industrial, Nasdaq, and Russell 2000. As of yesterday's close here is where the four majors stands on draw-downs from prior highs. 

S&P 500       -13.35%

Dow Jones    -10.05%

Nasdaq         -22.95%

Russell 2k    -23.20%

So 50% of the major indices are in bear market territory. Yet beneath the surface there are many more stocks down 20% or greater as the mega caps have held up relatively well. Whether you label this market a bear or not, the fact is it remains an extremely tough market to make money on the long side. Almost the exact opposite from April 2020 to the end of 2021. So the next logical question is, when will this market bottom and become a better trading environment for the bulls?

Lets drill into some detail and facts about the current situation.

This market has been historically challenging as both stocks and bonds are selling off. A nice chart from Jim Bianco shows the carnage in the bond market year-to-date. 

Image

The S&P is down 13% from the highs. Urban Carmel shows the other times the S&P has fallen > 13% without it becoming a nasty bear market. 

Image

Nautilus Research has a study of the NDX and how returns fare when you get a close below the 2-year moving average after being above it for one year. 

Image

Below is an area of support for the Nasdaq since the GFC. Here the Nasdaq found support at its 40 month exponential moving average during all the pullbacks since the 2008 crash. We aren't there yet but getting close. 

Other areas of support to consider. The Nasdaq has found a bottom when the % of stocks above their 200 day moving average became severely oversold. This threshold has been below the 20 level on four prior occasions since 2010. The 2011 European debt crisis, 2016 growth scare, 2018 taper tantrum, and the 2020 pandemic. Is this time different?


Along with these breadth measures and moving average supports one crucial element the market needs to find a tradable bottom is a blowout in sentiment and fear. As of this moment we haven't seen the level of fear during prior bottoms. During the prior panics since 2009 the VIX has exceeded 45 in each time period. Historically, VIX peaks before price. Is this time different?


Did the actions of the Fed to stem the potential devastation of the pandemic just lead to a massive blow off top? The QQQs had been in a very orderly bull market channel until the massive stimulus injection at the depths of the pandemic. Looks like a retest of the lower channel could be in play. 


The 1969 bear market may hold some clues to the potential of this decline as the S&P fell 37% from its peak. A great post from Walter Deemer that has some very interesting similarities to the current Fed's position. "In June 1969, Fed Chair William McChesney Martin, referring to the Fed’s thus-far unsuccessful attempts to lower the 6%-plus inflation rate, stated: "We're going to have a good deal of pain and suffering before we can solve these things." 

 Image

 Jurrien Timmer at Fidelity compares the current Fed tightening cycle, earnings growth deceleration, and multiple compression to the 1994 time frame which saw equities chop around the whole year while suffering a 14% draw-down. In 1994, the Nasdaq finished down 3.2% but endured a ton of volatility and choppy trading. 

Image 


Clearly the poster child for the current bear market has been high valuation growth and represented best by ARKK. So far the ARKK ETF has corrected 68% of highs. During the 2000 tech meltdown the Nasdaq corrected 78% from its March 2000 peak. If the draw down plays out similar, ARKK could see another 33% slide from current prices. It's remarkable how similar they look. 


So the big question we have after reviewing the data is: Is this a cyclical run of mill correction/bear market like 2010, 2011, 2016, 2018, 2020, or is this a systemic bear market like 2000 or 2008? I don't know the answer to that in real time and we won't know until it's over. My best guess is it will be somewhere in between with a bigger than 20% correction like 1969 but not a systemic decline like 2000/08. We'll need a spike in the VIX to eventually find a bottom. The great Fed experiment is unwinding and this will take time to undo all the excessive overreach over the last few years. This is why it is so important to be flexible and willing to hold large amounts of cash during a bear market. The last tweet from Dr. Eric Wish  sums it up perfectly; "I am incensed by pundits quoting studies implying not to exit the market because you could miss the best days, when the same studies show one did far better by missing the worst days. Don't be scared into staying in a declining market, unless you have years to recoup losses."


Image


Wednesday, January 26, 2022

What now?

I penned this in my 2022 outlook on the markets, "In conclusion, the data points to a mixed bag and has something for everyone. The bears can highlight tapering and volatility while the bulls can point to continued momentum. Our best guess is the first half will be more volatile than normal with multiple pullbacks." So far 2022 has started off in a high volatile one way market down. Yet, is the current sell off still within the normal distribution curve for pullbacks? The current correction has already eclipsed the minor 5% intra-year drop from last year. But it still remains well within the normal average. According to JP Morgan the average intra-year drop for the S&P 500 is 14%. 


I think the big difference this year is the volatility of the market that have produced wild swings in both directions. A tweet from Ryan Detrick sums this up. 


A recent Bloomberg article highlighted the recent action was very reminiscent of prior volatile bear markets.

By Lu Wang
(Bloomberg) -- That was some ride U.S. stocks just took.
The Nasdaq 100, along with the rest of the market, turned
on a dime in the middle of its worst selloff in two years and
vaulted back into the green, erasing a loss of nearly 5%. The
move was the latest in a series of heart-stopping turnarounds
that have dogged markets amid rising tensions around Federal
Reserve policy.
Days like Monday are not unprecedented. But when they’ve
come, it’s been at times that are not remembered fondly by
equity bulls. Today’s move was the biggest of its kind since
Jan. 8, 2001, in the middle of the come-down from the dot-com
bubble. Most of the other similar moves occurred in the three
years that crash took to play out, with a few others coming in
the heart of the 2008 financial crisis. 
The table below shows the past instances where the Nasdaq
100 erased an intraday decline of bigger than 4%. 

Date |Intraday Loss |Close
1/24/2022| -4.94| 0.49
11/13/2008| -4.76| 6.48
10/23/2008| -4.84| 0.17
10/16/2008| -4.18| 5.52
7/15/2002| -4.55| 2.02
6/26/2002| -4.19| 0.44
6/14/2002| -4.61| 0.28
10/12/2001| -4.04| 0.29
2/23/2001| -4.78| 1.16
1/8/2001| -5.15| 0.6
10/26/2000| -4.87| 1.92
8/3/2000| -4.25| 3.82

Lastly, a great blog from Dr. Brett Steenbarger shows why the current environment has been so difficult for some many traders. His last paragraph sums it up perfectly. 

"We're due for a bounce" is not a substitute for a rational assessment of markets and their possible outcomes.  No amount of trading psychology techniques can substitute for knowing what you're doing when you put capital at risk.  People who tout their "passion for trading" most often need to trade and that leads them to take undue risk.  Far better to have a passion for good bets.  If you know that broadly oversold markets move a lot on average, the smart bet is to shorten your time frame, reduce the volatility of your returns, and find short-term bets that pay well without a scary downside.

The character of the market has certainly changed over the last few months and has been exasperated since the start of the year. It remains in a high volatility regime as the market gets more oversold. When the dust settles and the selling is exhausted there will be an abundance of opportunities on the upside. Trying to time it is almost impossible and why I remain very cautious in this tape as I expect volatility to remain elevated and a choppy trading environment. I am prepared for all scenarios and continue to adjust as new information arrives.


Friday, January 7, 2022

What's in store for 2022

As we embark on 2022 many market pundits are putting out their yearly predictions. We always find these more entertainment and theater rather than actual advice because the honest truth is, no one has any clue what the future holds and the market doesn't care about my opinion. Frankly there are always issues to worry about: Omicron shutdowns, new variant, supply chain glitches, labor shortage, school closures, higher inflation, rate increase cycle, Mid term elections, military conflict, etc. Our investment philosophy isn't predicated on predicting the future but rather reacting to current data. We use current and past data to help shape a thesis for potential outcomes in a scenario analysis manner. Then when events and conditions change we adjust our positioning and risk accordingly. The old adage sums it up perfectly, "the only constant in life is change".

With that said, to look out to next year we need to first assess what has actually taken place in real time. 2021 provided great returns across the asset class spectrum for everything except gold and treasuries. Jurrien Timmer from Fidelity sums this up in his table of investment returns.

Even as the general market provided health returns there was plenty of churn under the surface. Remarkably, the average Nasdaq drawdown from YTD highs is a whopping -42%.

Cathie Wood has taken a lot of heat this year as her Ark funds have under performed. But a simple ratio chart of the ARKK ETF to the SPY shows how dramatic the selling has been in high valuation growth names. ARKK peaked in February and has drastically under performed the S&P since then. Currently it is more than 50% of it's YTD high. 


Most of the destruction in high beta growth can be attributed to the pivot from the Federal Reserve to speed up the tapering process to fight inflation they let get out of control. A tweet from Puru Saxena highlights how expensive stocks have lagged all year when plotted against the Fed's balance sheet.


This begs a bigger question. What is the impact from QE on the markets. Clearly quantitative easing has been a tailwind to the S&P. However, the reversal of QE (tapering) that reduces liquidity in the economy seems to be a headwind. The following two charts from William O'Neil touch on this.

On top of that the Fed's actions have historically triggered greater volatility. 


The following two charts increase the likelihood for the potential for a more volatile environment next year. Low volatile years like 2021 are historically followed by more volatility.


The presidential cycle doesn't do any favors either. The first three quarters are weaker than normal heading into the mid term elections.


One of the biggest market concerns is the rate of inflation and the pace of interest rate hikes from the Fed. However, should we be scared of rate hikes? Bespoke has great data on this. What I found most interesting was, "as shown, the broad market tends to do poorly in the first three month of a tightening cycles over recent year, bu longer-term that's a buying opportunity as forward returns average 7.1% (86% positive) over the first six months follow a rate hike."

Ken Fisher validates this theory that the market shouldn't be spooked by rate hike cycles. Outside of the mid 70's stagflation, equity returns have been positive during rate hike cycles.


Some more data points in the bull case shows how strength begets strength. One of our favorites Ryan Detrick shows what happens after big up years in the S&P 500. The average return next year is 11.6%.


Another interesting stat lies in the fact that 2021 was a unique year. It was only the 5th time in history going back to the 1920's that the S&P finished up double digits three years in a row. We looked at what happened the 4th year after three straight double digit years. The returns surprised us.

Year Yearly Return
1942 12.43%
1943 19.45%
1944 13.80%
1945 30.72%
1949 10.46%
1950 21.56%
1951 16.46%
1952 11.78%
1995 34.11%
1996 20.26%
1997 31.01%
1998 26.67%
2012 13.41%
2013 29.60%
2014 11.39%
2015 -0.73%
2019 28.88%
2020 16.26%
2021 26.89%
2022 ?
Average 4th Yr Returns 17.11%


In conclusion, the data points to a mixed bag and has something for everyone. The bears can highlight tapering and volatility while the bulls can point to continued momentum. Our best guess is the first half will be more volatile than normal with multiple pullbacks. But as the supply chain gets worked out after Omicron dies down that should help inflation ease. Tapering should be done by the first quarter and we should have the first rate hike behind us sometime in the first half. That could set the stage for a second half rally as pent up demand comes on board and a strong finish once the Midterms are behind us. As I said in the beginning, the market doesn't care about my opinion. That is why we prefer to see how the tape reacts to new information and we'll adjust accordingly. 

Happy New Year!