Tuesday, June 30, 2015

Where Do We Stand?

So where does the market stand after the worst daily sell-off in more than a year.   All the big domestic indexes closed in extremely weak fashion on Monday.  The DOW and NYSE closed below their 200 day moving averages as the S&P 500 finished just a hair above its 200.  The 200 day-MA serves as a nice gauge of the long term trend of the market and a close below it is considered fairly bearish.  Small and Mid caps along with the Nasdaq are in much better shape as they reside further away from their respective longer term moving averages.  On a bearish note all three index's now have failed breakouts to the upside. 

However, what we did see on Monday was a big flush out in the market.  This was the reset we have been talking about for a few weeks after we got overbought.  We had a 90% down day on the NYSE with a huge expansion in 20 day lows across all markets.  The chart below from index indicators shows the expansion of 20 day new lows on the S&P 500.  This was coupled with a spike in the put/call ratio and the VIX index.  The VIX traded at the highest levels since the Jan/Feb sell-off.  Recent history suggests market lows coincide with oversold levels as the put/call and VIX spike.  Will history repeat itself?  We have no way of knowing the outcome.  If the Greek issue is resolved and somewhat contained, we imagine we are closer to making lows.  The risk is the fear of a contagion that could really bring in some volatility and much more downside.  It remains a very fluid situation. 


If we look at some breadth indicators we can see we are approaching areas on a longer time frame that historically coincide with a bounce in the market.  The % of S&P 500 stocks above their 50 and 200 day moving averages is nearing those anticipated bounce levels.  Now, in an extended move lower such as the European debt crisis in 2011 these indicators can stay oversold for much longer periods. 


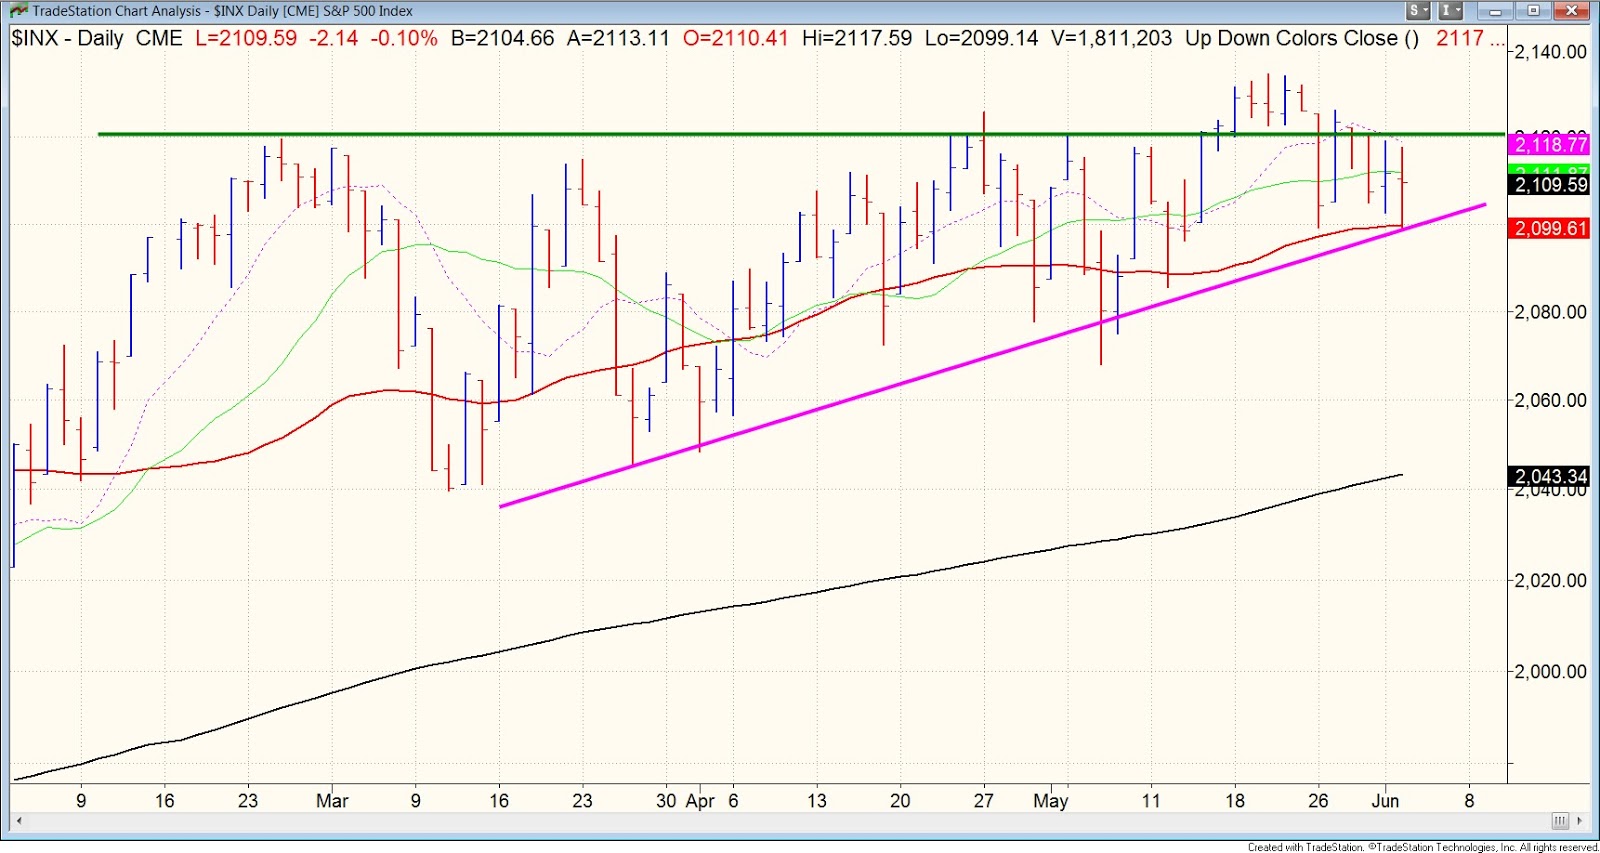
From a longer term view the S&P 500 is in danger of breaking below the up-trendline from the 2009 lows.  A significant break of this support area could also bring in a bigger correction. 


The markets have some long term support coming into play as we reach short term oversold levels.   These areas have been opportunities to add to long positions in the last few years because of the frequent V-bottom formations.  However, there's always the chance that this is the beginning of a bigger correction and a V-bottom is not in store this time.  We are willing to be patient to see how the trend resolves itself. 

Thursday, June 25, 2015

#MillennialsHateStocks

On Tuesday, we wrote about the seeming lack of enthusiasm surrounding a stock market that is at or near all-time highs depending on which index you're following.  While this is in part due to the incredibly frustrating movements of the market over the last several months, we also believe certain structural shifts can be blamed.  

We mentioned some anecdotal evidence presented by Raymond James' Jeff Saut in Tuesday's blog:

"I have been buying the Barron’s every Saturday for the last 20 years, and the local grocery store where I buy it only orders about 5 of them. They are never sold out and what’s possibly more interesting is that they have stopped carrying the IBD. Now, I find this to be somewhat interesting only from the respect of the public’s lack of interest in the stock market."


And yesterday, Bloomberg came out with data further suggesting the public's dour mood toward stocks. The piece looked at the so-called Millennial generation's (defined as those between 18-34) thoughts on investing and saving.  A recent survey compiled by Goldman Sachs showed that only 18% of millennials polled viewed the stock market as "the best way to save for the future."  Meanwhile more than 40% said stocks weren't for them either because they didn't know enough, they thought the market was unfair or because it was too volatile of a venture.  The remaining 40% felt "skeptical" about the market and preferred to access it in small amounts or via "low risk" investments.


These results don't come as a complete surprise to us as we've had plenty of conversations with folks in the 25-40 age bracket that feel similarly.  An overriding distrust or avoidance of the stock market often comes up.  Also from the survey:

About 43 percent of the survey participants said they wouldn’t spend more than an hour getting guidance on an investment, while 13 percent of them said they wouldn’t seek out advice at all. Most also ask their parents how to handle their money.

In the event they came into a sizable sum of cash, almost half said they’d use it to pay down debt, which may not be surprising considering they’re shouldering more than $1 trillion in outstanding student loans. 

While this data is pretty eye-opening by itself, when we factor in the reality of Baby Boomers continuing to downshift the aggressiveness of their investment portfolios, it's easy to see that structural changes could be afoot.  Obviously we're not saying the stock market is headed toward extinction but it certainly could look much different in 10 years.  Less retail "home-gamers", a greater focus toward reducing debt and lower risk tolerances overall.  The counter-argument being that maybe this consensus attitude begins to unwind and helps to drive the next secular bull.  Could millennials eventually get on board with stocks and pave the way for the next boom and bust cycle?

It will be interesting to see how this plays out.

Tuesday, June 23, 2015

Missing: Bulls

We continue to be fascinated by the level of skepticism that grips this current market.  In recent days we've seen evidence, both anecdotal and statistical, that investors are anything but too bullish even though markets are at or near all-time highs.  Just today, the Russell 2000, Nasdaq and the S&P Midcap 400 made new highs while the S&P sits less than 1% from its high water mark.

Further, the S&P has yet to have a 5% pullback in 2015 and it's been more than 900 trading days (more than 3.5 years) since it had a 10% correction.  It's been a frustrating slow grind higher that's failed to convince most participants that further legs higher are coming.  Per Jeff Saut of Raymond James, the Dow Jones Industrial Average so far in 2015 "has somehow managed to oscillate some 13,000 points between its hills and valleys despite only gaining 296 points YTD as of yesterday’s close." These conditions have gone on to create an environment where investors, and especially the media, cry panic at the sight of even the slightest pullback.  Over the last few months, each time the market has fallen over a multi-day period, the bears come out of the woodwork insisting this is "the one."

As a result, we've sensed an attitude from some corners that this market just isn't for them.  That they've missed their chance to participate.  Here's more from Saut regarding a recent email he received:

"In last Friday’s Morning Tack I shared an email from one of our particularly insightful Financial Advisors (Peter Muckerman) who wrote:"

I have been buying the Barron’s every Saturday for the last 20 years, and the local grocery store where I buy it only orders about 5 of them. They are never sold out and what’s possibly more interesting is that they have stopped carrying the IBD. Now, I find this to be somewhat interesting only from the respect of the public’s lack of interest in the stock market.
Also, this is profoundly interesting since one of the panelists speaking up on the Hill in regards to the recent “DOL Proposal” noted that: “some 50% of all TSP money is sitting in the G Fund.” Now, that is striking to me, and it tells me: 1) They have gotten no advice, 2) Has the Government failed in their own fiduciary responsibility to educate their work force?, 3) the general public still hates the stock market, and 4) The market has further to run on the upside.
To clarify Jeff wrote:

"Now I lived in the D.C. area for years and therefore am familiar with many of the acronyms. But for those of you that are not, DOL stands for the Department of Labor and the DOL proposal would change the way investment advice is given for retirement accounts. On Tuesday a House bill was introduced to stop the DOL’s proposal to change investment advice standards for retirement accounts. TSP is the acronym for Thrift Savings Plan, and the G Fund is basically a Treasury-centric money market fund. Now that we have the acronyms right, we can better understand Peter’s point. The investing public has very little interest in stocks, which is yet another reason we are a long way from the end of this secular bull market."
Worch here -- if this statistic about Department of Labor retirement accounts is accurate and half of all assets sit in what's essentially a cash account, that is a pretty staggering figure.  It goes to show just how distrusted this bull market has been.
The various sentiment polls also echo this stance.  The most recent AAII Investor Sentiment Surveys have been flat out bland.  Survey participants are at their most neutral levels in over a decade and the number of bulls has been at historic lows for months now.  Per Ryan Detrick, "the recent 8-week MA of the bulls came in at just 26.96%, this incredibly was the lowest reading since the week of the March 2009 low!  Below shows all the times this reading came in less than 28% going back 20 years.  Nailed the 2003 and 2009 lows and caught a low in 2005 before a nice move.  The one caveat is it was drastically wrong in 2008."

It's said that the stock market aims to frustrate the majority and that certainly seems to be what's occurring here.  People just can't get fully comfortable with owning stocks and want a reason to press the sell button.  So, how does the market continue to frustrate from here?  By grinding along higher and not yet offering that 5-10% pullback that so many are anxious for.  If it stays in this mode, it's hard to see excessive bullishness setting in any time soon.


Sunday, June 21, 2015

Week in Review (6/15 - 6/19)

With Fathers Day approaching this weekend we are going to keep commentary light so we can enjoy the one day of peace we Fathers deserve.  This week featured new closing highs for the Nasdaq, Russell 2k, and Midcap 400 index.  We are waiting for confirmation on the S&P 500, Dow, and NYSE.   The S&P is testing the upper range of its current consolidation.  Considering the upside breakout in the other indices we think the lagging ones will play catch up.


The VIX continues to dry up and trade towards the lower range but if we look at China we can find plenty of volatility.  Friday alone the Shanghai composite was down 6.4%.  For the week it is down over 13%.    There were many reasons that contributed to the weakness but if we look at price alone a 13% correction is normal after the run this market has experienced. 


From a sector view we saw strength in health care and staples while financials and energy lagged for the week.


Here's what we were reading this week:

Solving the riddle of weak late-day trading

Are bulls really at their lowest level since march

Correlations aren't constant

Rising interest rates and sector performance

SP 500 facts over opinions

For all those Fathers out there have a wonderful and safe Fathers Day!

Thursday, June 18, 2015

The Market is Forward Looking

The stock market is commonly accepted as a forward looking mechanism. Its participants are counted on to "price in" all current and expected data in order to establish a fair value for each security. While there will always be asymmetries available to exploit, it generally functions in an efficient manner.  

This week has served as an interesting example of the market pricing-in data and events ahead of time. If, over the last few weeks, you had invested in stocks based solely on headlines your nerves probably kicked up a bit.  Various pundits were predicting a rate raise coming out of the June Federal Reserve meeting even though the Fed funds futures market was telling us there was essentially zero chance of a hike.  Similarly, we were seeing headline predictions of the stand-off between Greece and the European Union becoming more contentious and to some unknown extent contagious to stocks here in the U.S..  However, the market was suggesting something entirely different. 

The VIX had perked up slightly in recent weeks but it stayed at more than manageable levels in front of this news.  Additionally the indexes, while they've gone back and forth, continue to stay in the range we've been watching for months. It seems clear that the market is telling us, at least in the short term, is that it needs a greater catalyst in order to make a sustained move in either direction.  Everything priced-in right now suggests we're in a boring market for the time being.

Tuesday, June 16, 2015

Measuring Breadth: # Stocks Up 50% In A Month

We track a number of indicators on a daily basis that serve to identify overbought/oversold levels in the market.

One such tool we've found to be particularly useful in identifying potential short-term tops and oncoming weakness is a simple breadth indicator we picked up from Pradeep Bonde and his incredibly useful website, StockBee.  Within his daily Market Monitor analysis, he tracks the number of stocks that are up 50% in a month.  The idea being that when you get an excessive reading in this gauge the market may soon take a breather.  Generally, any reading higher than 20 starts to be considered excessive and we recently touched 25 on June 5th.  Going back to 2013 (see chart) when this V-bottom market really kicked into gear we can see how this tool has served as a helpful guide for identifying short-term excess.

We went back and looked at all instances where the Stocks Up 50% in a Month Indicator hit a reading of 25.  Looking out 10-days after such an occurrence, the returns on the Nasdaq averaged a loss of 1.7% versus a gain of .85% for all days during the data set.   If we looked out 20-days from a reading of 25, the index averaged a loss of .78% versus another gain of 1.7% for all days in the data set.  The evidence presented during the last few years has shown that when this indicator is stretched, buying stocks has been a low probability bet in the short-term. 

Further, we typically see this reading become overheated after a strong move up in the index as this is a natural tendency of momentum and breadth.   However, what's striking is the divergence that's taking place right now.  Essentially the markets have gone sideways for months but underneath the surface we are seeing some impressive moves in individual names.

While a few of these single stock surges can be attributed to the booming M&A environment, the indicator has remained elevated (above 20) for multiple weeks now.  So a question that looms for us is: will this high number stocks up 50% in a month eventually lead to some degree of selling in order to flush out the excess or will the broader market play catch-up so as to reinforce the moves in these individual names?  Is the strength in certain individual stocks a clue that the current consolidation wants to eventually resolve to the upside??

If the resulting move is in fact higher, it would serve as a reminder that markets/indicators can stay overbought for extended periods especially during sustained directional moves.


Yet another simple tool we use in an effort to analyze the health of the market.  

Sunday, June 14, 2015

Week In Review (6/8 - 6/12)

Stocks finished the week largely unchanged as the averages zigged and zagged all week.  The S&P 500 started the week by dropping 15-points between Monday and Tuesday, it then staged a massive 25-point oversold bounce on Wednesday, did little on Thursday and showed its fatigue on Friday by falling back to where it started the week. A 60-minute chart of the week shows the weekly progress.  Meanwhile the VIX started the week testing the upper range only to once again sell off during the week as the market rallied.  


The daily chart continues the range bound theme that we have followed for months. The S&P 500 is creating a nice base/consolidation to make a nice move.  The path of least resistance makes the case for an upside breakout but we'll wait for price to confirm in either direction to have more confidence.


From a sector standpoint financaials and consumer staples led the way while weakness showed up in the energy patch.  The chart below from stockcharts sums up the weekly sector rotation.  


Here's what we were reading this week:


Thursday, June 11, 2015

"Risk Means More Things Can Happen Than Will Happen"

The title of this post is a comment originally made by Elroy Dimson, a professor at the London Business School, and recently shared further by Howard Marks of Oaktree Capital.  Mr.  Mark's market commentaries are always a must read for us and his June 8th letter, Risk Revisited Again, is no different.  We definitely recommend it to you as well.

While Mr. Marks and his team at Oaktree primarily operate in an entirely different wing of the investment world (fixed income), we share very similar rules and philosophies when it comes to risk controls.  His letter comes at a good time as another note that recently hit our inbox touched on the topic of risk in a way that struck a chord with us.  Peter Brandt posted some quick comments on his experience with drawdowns during his 5+ decades in the business and how he has come to approach them.  To summarize Mr. Brandt's piece, he essentially says that a trader that intends to survive in the business must learn to accept, expect, and even appreciate drawdowns.  They are a fact of life and one must learn to take them in stride.  It's such a simple concept but so many investors, both professional and retail, for whatever reason (pride, greed, temperament, etc) fail to adequately address risk.

Today, we finally had the opportunity to read Mr. Marks' 20-pages of commentary and it (and Mr. Brandt) compelled us to once again post on the topic of risk.  We've compiled some of our favorite Howard-ism's from the letter and shared them below:

  • The more risk we take because we believe the environment is low-risk in character, the less the environment continues to be low-risk in character.
  • How can investors deal with the limitations on their ability to know the future? The answer lies in the fact that not being able to know the future doesn't mean we can't deal with it.
  • The future should be viewed not as a fixed outcome that's destined to happen and capable of being predicted, but as a range of possibilities and, hopefully on the basis of insight into their respective likelihoods, as a probability distribution.
  • Many possibilities exist today...this uncertainty as to which of the possibilities will occur is the source of risk in investing.
  • It's not reasonable to expect highly superior returns without bearing some incremental risk.
  • While I don't think volatility and risk are synonymous...in the short run, it can be very hard to differentiate between a downward fluctuation and permanent loss.
  • Thinking risk control is easy is perhaps the greatest trap in investing, since excessive confidence that they have risk under control can make investors do very risky things.
  • The key prerequisites for risk control also include humility, lack of hubris, and knowing what you don't know.
  • Risk avoidance isn't an appropriate goal.  The reason is simple: risk avoidance usually goes hand-in-hand with return avoidance.  While you shouldn't expect to make money just for bearing risk, you also shouldn't expect to make money without bearing risk.
  • It's the job of investors to strike a proper balance between offense and defense, and between worrying about losing money and worrying about missing opportunity.  Today I feel it's important to pay more attention to loss prevention than to the pursuit of gain.


Tuesday, June 9, 2015

Multiple Time Frame Analysis on the S&P 500

With the current weakness in the S&P 500 we wanted to look at some areas of support across multiple time-frames that we see as important structural areas.  We like to start from a longer-term perspective before drilling down to the shorter-term picture.

Monthly

We continue to watch the 12-month moving average as a nice long term trend-following guide.  This long-term indicator will keep you on the right side of the market most of the time.  As of today, the line in the sand remains around the 2040 level.  We try not to get too complicated here.  When above the line we are in a bull phase and when below the line, a bear phase.


Weekly

The S&P is testing the long-term up trendline from the 2009 bottom.  This giant rising wedge is getting squeezed and will be watched to see which direction price takes us.  A significant break below this trendline will be viewed as bearish considering the nature of this uptrend.


Daily

We are currently operating in a trading range and recently experienced a false breakout to the upside.  As of today, the S&P has broken the up trendline from the February bottom.  It remains a trendless, choppy range and the areas of support to watch will be the May lows (2067), which was close to being tested today during the morning weakness.  Next, the March lows (2040), which continues to come into play on multiple time frames.  The rising 200-day moving average currently stands around 2046.  This is a significant long-term support level.


To sum it up, the market needs to hold the 2040 level to keep the current uptrend in tact.  Besides that, the daily fluctuations act as noise from a trend following perspective.  If that level is breached and we closed below it on a monthly basis, that could set the stage for a bigger correction that so many have called for.  We always prefer to let price confirm one way or another. 

Sunday, June 7, 2015

Week In Review (6/1 - 6/5)

The week ending June 5th saw the S&P 500 finish down -0.70% and the Nasdaq flat while the Russell 2000 was up more than 1%.  Friday's upside surprise in the monthly in the employment report did little to move the market in either direction as the big cap indexes finished the day largely unchanged.  However, the week as a whole certainly had a more volatile feel than what we've seen recently.  Another round of Greece concerns and some strong currency and interest rate moves bore primary responsibility for this.


On a year to date basis, the S&P 500 has once again slipped back into its drawn out range after attempting an upside breakout over the last few weeks.


The Nasdaq and Russell 2000 have asserted themselves as the clear domestic stock market leaders through the year's first 5+ months.


As mentioned above, the pullback in stocks last week was due in part by the recent volatility of the bond market as the 10-year has fallen below its 200-day moving average and is testing major support on the longer term weekly chart.


Thursday, June 4, 2015

Here We Go Again

Once again macro forces have freaked out the equity markets and volatility is spiking.

Overnight, the markets were treated to a rise in global yields, most notably in Europe.  This caused a negative open and gap down in equity indexes.  The S&P actually stabilized and almost made it back to break-even before buckling to more selling which then intensified in the afternoon as the market was bothered by the lack of progress in the Greek negotiations.

So where does this leave us?  The S&P has quickly gone from overbought to nearly to oversold.  We are entering areas of support that have signaled buying opportunities during this range bound market.  Since the trading range began in late December, moves to the lower bollinger band on oversold readings coupled with a rising VIX have served as a nice area of support.  Buying this level has been the trade of choice in this choppy sideways range.  With the bollinger band range the lowest in 8.5 months, we will get a range expansion at some point.  Now which direction the breakout occurs is anyone's guess and we prefer to wait for price confirmation before getting more confident in either direction.


Tomorrow's employment report should offer up some more pre-market volatility and we'll see how equities respond after the opening bell.

We'll leave with this timely tweet from


And to emphasize his point, here's this ridiculous headline after today's close from Business Insider.  Meanwhile, the market was down less than 1%...Sigh.


Tuesday, June 2, 2015

Keeping An Open Mind

We've used this space many times to advocate the importance of always keeping an open mind when trading/investing.  Today is another one of those occasions and the motivation comes from two of our favorite market commentators currently offering up two very different near-term views.

First, Jeff Saut, the esteemed Chief Investment Strategist for Raymond James, continued yesterday with his long held stance that stocks look poised to move higher.  Saut has been saying for years, and so far correctly, that we are in the early-mid innings of a long-term secular bull.  And more immediately, he believes the market has been gathering steam over the last several months to make yet another meaningful push to the upside:

The call for this week: Last week the “secular bull market” theme came into question for the umpteenth time since our “bottom call” of March 2009. The latest boogie man has been the D-J Transportation Average (TRAN/8299.75), whose upside non-confirmation we have discussed ad nauseam since its occurrence last December when the Trannies failed to confirm the new all-time highs in the Dow. Unfortunately, many of the indices I follow failed to extend their upside breakout to new all-time highs recently. Nowhere was this more glaring than with the D-J Industrials (INDU/18010.68), whose upside non-confirmation by the Transports widened even more last week. Indeed, the Trannies extended their breakdown below the 8520 – 8580 support zone and in the process the 50-day moving average (DMA) fell below the 200-DMA (the death cross). Still, the Industrials have not fallen below their respective support level. The same can be said for the SPX as it continues to reside above the 2090 – 2100 level. Lost in the technical trauma has been the improvement in earnings’ revisions (see chart on page 3). This morning the preopening futures are marginally higher on no over the weekend news. I continue to think the SPX is organizing itself for a move higher as long as the 2090 – 2100 level is not breached.

Mr. Saut has been consistent with this opinion for many months and believes that as long as the S&P 500 can maintain above the recent support zone it's created for itself, then eventually it will rally higher. This from his Morning Tack piece today (emphasis ours):

Well, as stated in the last lines of yesterday’s missive, “This morning the preopening futures are marginally higher on no over the weekend news. I continue to think the S&P 500 (SPX/2111.73) is organizing itself for a move higher as long as the 2090 – 2100 level is not breached.” My models suggest the anticipated upside may be delayed until this Friday, or until early next week, but that it is coming. If the “call” is wrong, I will say it is wrong and adjust accordingly, but until then I am sticking with that rally theme.


We highly recommend you make his comments a part of your daily reading.

Somewhat counter to Saut's calls for a near term move higher, Convergex's Nicholas Colas in his market briefing today titled "Warriors, Come Out to Play", calls U.S. equities "brittle" and notes that the S&P is up only 2.6% year to date and all of that gain has come since April as Q1 was a washout. He goes on to assert that (again, emphasis ours):

Valuation of 18x current year earnings means domestic stocks are priced for perfection in a distinctly imperfect world: negative revenue growth for multinational companies, increasingly negative earnings comparisons, and a domestic economy stuck in (at best) first gear. Yes, central bank liquidity from Japan and Europe may well push global equity markets higher.  But what we really need is a pullback – that classic 10% correction that flushes out weak hands, reestablishes the discipline of “Risk” in the “Risk-Return” equation, and shows capital markets how to do more than just follow central bank liquidity.  So watch June’s price action in U.S. stocks very carefully, because this process needs to start now.  The bull market that began in March 2009 is now an ancient bovine indeed.  After all, better 10% now than 20% or more later in the year.  The first is inconvenient.  The second is unwelcomed. 

Mr. Colas then uses the ancient Greek story of "Anabasis" and the cult classic movie "The Warriors" to serve as analogies for what he believes may be the best course of action for stocks in the near term. In each story, victory was achieved by first making a successful retreat away from overwhelming odds.  He closes with:

Either way, investors should remember that sometimes a small retreat on your own terms is better than a long march to the sea.

While he is not predicting that a 10% fall will happen, he is suggesting that, given the facts, a pullback of that nature should and deserves to happen soon.  Yet, he nor Jeff Saut nor us, know what the market has in store for investors next.  And that fact circles us back to keeping an open mind. Saut makes that point even more clear by stating it in his bullish market call.  We love the fact that while he has an obvious bullish bias, he gets out in front of the risk that he'll be wrong and is willing to "adjust accordingly."

That is the critical point here and something with which many (most?) investors struggle.  The ability to admit to being wrong.  Jeff Saut is one of the most tenured and respected minds on Wall St., a guy whom at this point gets a pass for making a bad call, and yet here he is making sure that everyone knows that success in this business demands flexibility and the ability to be wrong and move on.

It's perfectly fine to develop investing biases and to settle on an expected outcome however if you're not willing to admit when the market has proven your bias wrong, you and your portfolio are in trouble.