"For now the momentum is clearly in the hands of the sellers. Extremes overshoot on both sides and this time will be no different. I or anyone else has no clue when this will end. It will end when it stops going down and I have the faintest idea of when that is. But I do know this will pass and the best thing I can do is stay disciplined and don't panic. Take a deep breadth and relax and let the psychology play out as nothing else matters."
What has transpired since then is like a roller coaster of emotions and price action. We have witnessed extremes in many indicators on both ends of the spectrum. As always, lets dive into the data to help us shape a thesis and guide our decision making process of how to navigate the current market.
I first want to start with just the price action of the indices and compare that to prior hard sell offs in the past to give us an idea of how the current market is reacting to prior patterns. What we know is the current market experienced the fastest bear market from all time high in history. The next questions begs, is the bear market over already?
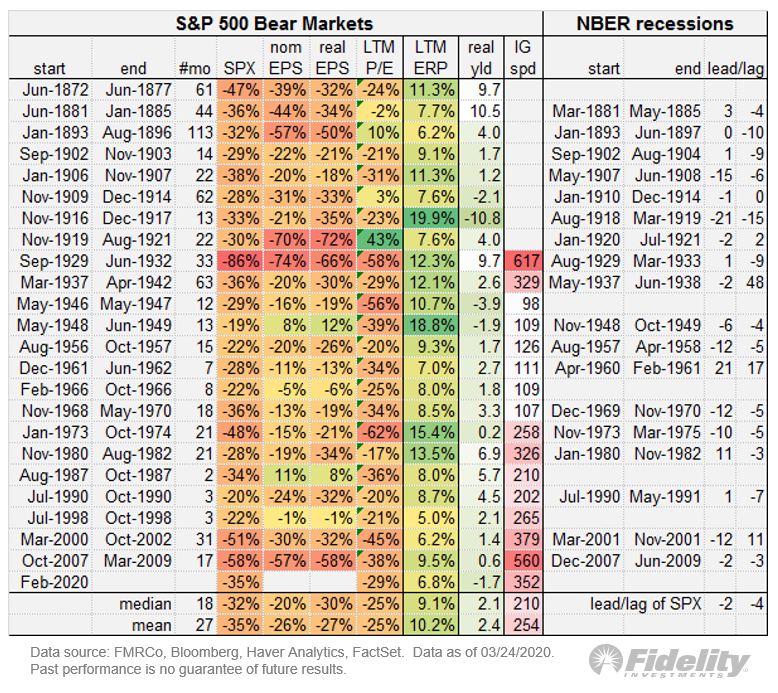
So far the S&P 500 declined 35% from highs to the 3/23/20 low which is in line with the average bear market decline all in one month. Below are all bear markets going back to the late 1800s from Jurrien Timmer at Fidelity.
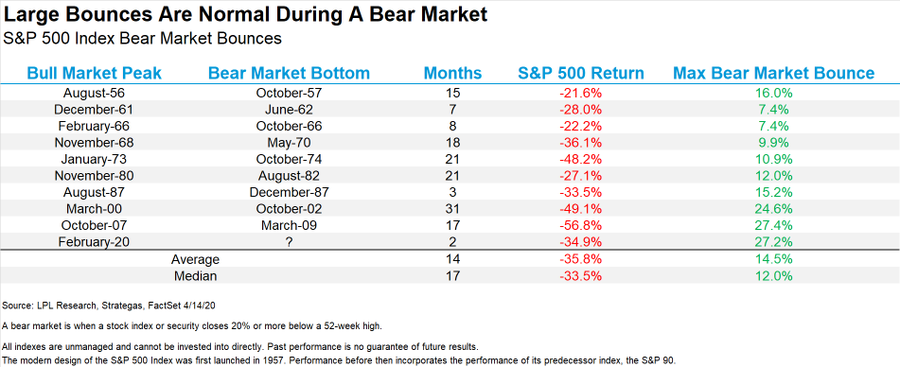
The next list from Ryan Detrick shows all bear markets since the 1950s and how quickly they recovered losses.
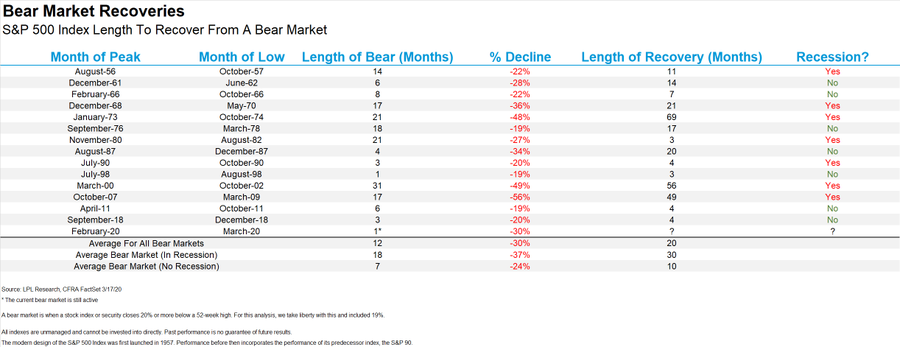
From the data above we can see a certain pattern develop. The quicker the decline the faster the recovery as was the case in 1962, 1966, 1990, 1998, 2011, and 2018. The outlier seems to be the 1987 crash.
Now lets turn our attention to how the VIX behaves around equity plunges. Historically, the VIX peaks about 75 days before equity prices bottom, based on bear markets since the VIX was created in the mid-1980s. The VIX peaked on 3/16/20 at 82.69 on a closing basis which is an all time close even higher than 2008 great financial crisis. Add that number of days to March 16th and you arrive at a market bottom sometime in June.

Yet, the S&P has already rallied roughly 30% off the lows. Is that enough to assume the lows were put in on March 23rd just 5 trading days after the VIX peaked? Considering the speed of the decline we think the most appropriate comparisons are prior waterfall declines we discussed above. In 1998 and 2018 the VIX peak on the same day in 1998 and 3 days prior in 2018. We don't have VIX data prior to 1990 so the only other two bear markets in that time frame are 1990 and 2011. The VIX peaked 49 and 56 days prior to the S&P bottoming. So even though the average is 75 days it is entirely possible the VIX peaked and the market bottomed simultaneously.
Next we'll look each waterfall bear market and look how priced rallied off the bottom and see if it leaves any clues or patterns. Below are daily charts of each bear market with the VIX and % drawdown in the bottom half of the chart. Once again we don't have data on the VIX prior to 1990.


Currently, the S&P has rallied right into a declining 50 day moving average and is above the 50% retracement level of the whole down leg.
- 1962 had a near retest and months of choppy trading below the 50% retracement level
- 1966 had 2 months of range bound trading below the 50% level before resuming higher
- 1987 had almost 2 years of sideways chop below the 50% retracment before resuming higher
- 1990 had 2 volatile months once it hit the 50% retracement before quickly turning higher
- 1998 essentially went right back to highs as quickly as the decline
- 2011 spent 2 volatile months rallying and selling off before trending higher
- 2018 was similar to 98 and V-bottomed
The next question would be what if the bottom isn't in. All scenarios are possible but we try and use current market data with prior patterns to increase our odds. If the market rolls over and takes out new lows we'll have to adjust our study to include more extended bear markets of the past to identify patterns. Presently, we are under the assumption the market has bottomed and looking at possibilities of and extended rally and how that plays out.
One reason that gives us more confidence the market has bottomed has been the extreme readings in breadth and sentiment on both extremes. Listed are some of the bearish extremes hit during the March plunge.
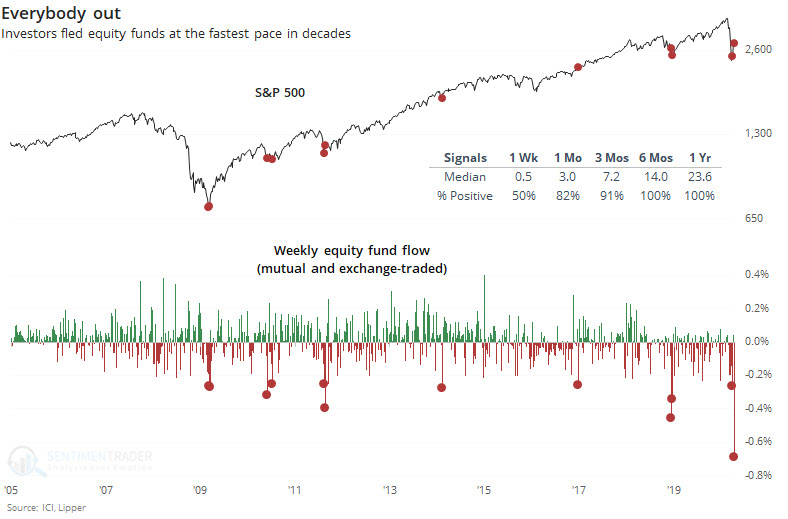
Below are from the great site sentimentrader.
This week saw an outflow from equities of more than $60 billion. That's around 0.7% of the total asset base. It's 50% more extreme than any outflow in almost 20 years, during the best week for stocks in almost 50 years.
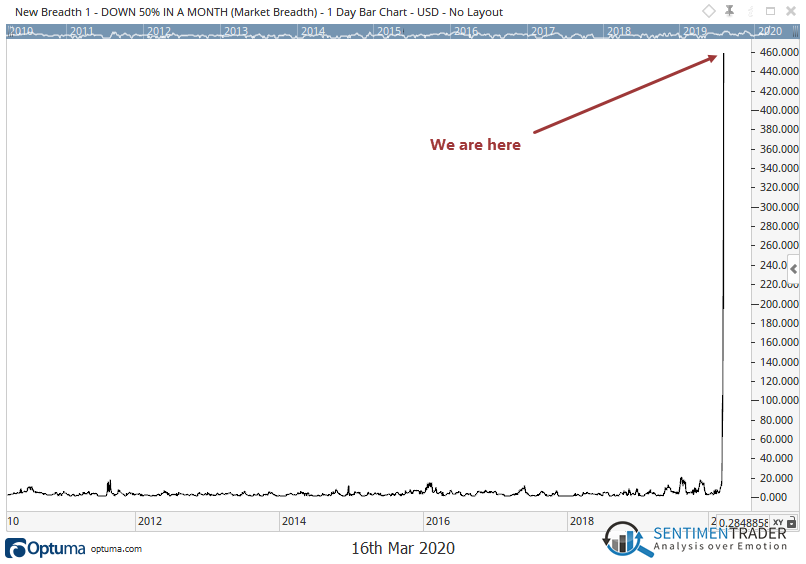
Within a month, 460 stocks in the Russell 2000 have lost half their value. The prior high over the last decade was 20.
Similarly, the S&P traded 26% below the 200 day moving average. Going back to 1960 this is only the forth time it has traded this low. The other three times were Oct 2008, July 2002, Oct 1974.

Another breadth measure we track internally is the amount of stocks down 50% or more in a month. Historically this indicator flashes oversold readings above 20. In fact, prior to this year the highest reading ever was 33 in August 2011. During the 2020 crash this indicator hit 1119 showing how ugly this decline was.
| Year | Max of Stocks Down 50% in a Month |
| 2010 | 7 |
| 2011 | 33 |
| 2012 | 13 |
| 2013 | 14 |
| 2014 | 27 |
| 2015 | 21 |
| 2016 | 19 |
| 2017 | 11 |
| 2018 | 19 |
| 2019 | 24 |
| 2020 | 1119 |
Since the market low on March 23rd the S&P has rallied 31% off the intraday low. This rally after 18 trading days is far outpacing the bounces from all bear markets we've studied. Ryan Detrick touched on this a few days ago in a tweet.
Consequently, we are getting the exact opposite of a month ago. Indicators are flashing overbought conditions on historic proportions.
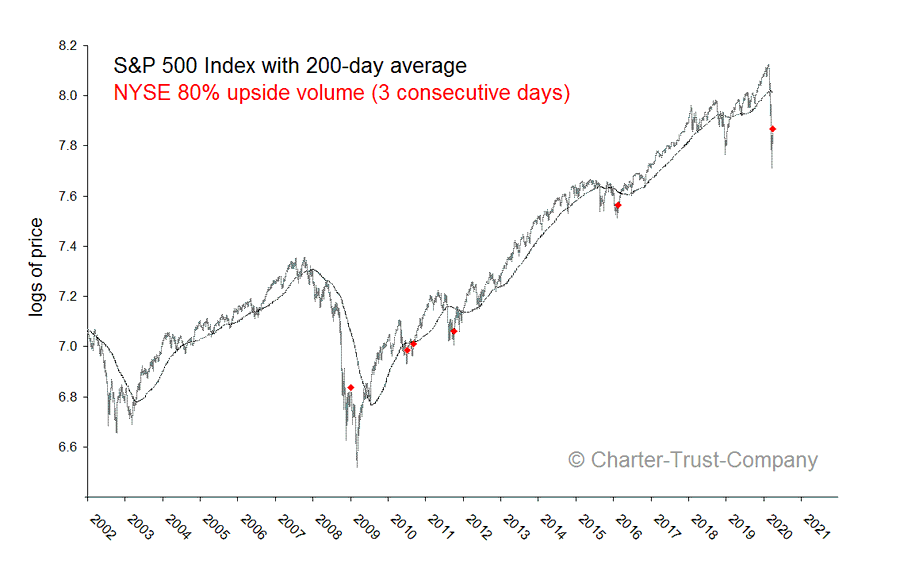
A tweet from Mark Ungewitter shows triple 80% upside days have evidenced market bottoms in 3 out of 4 cases since 2002 with a glaring exception on January 2nd, 2009. Never easy, is it?
Sentiment has come roaring back as witness by sentimentrader recent tweet.
Sentiment has come back with the stock market's rally as a *RECORD* number of media stories mention "back to normal". Many of these stories are from the same people calling for another market crash at the bottom in late-March

Once again the number of stocks up 50% in a month hit an all time high (144) going back to 2010. The next closest was 80 back in October of 2011.
| Year | Max of Stocks Up 50% in a Month |
| 2010 | 25 |
| 2011 | 80 |
| 2012 | 40 |
| 2013 | 29 |
| 2014 | 43 |
| 2015 | 26 |
| 2016 | 73 |
| 2017 | 26 |
| 2018 | 30 |
| 2019 | 41 |
| 2020 | 144 |
We started this study trying to solve the question of has the bear market ended. Our conclusion is the market has indeed bottomed. Now we would like to know how the rally will transpire. I wish I had a crystal ball but unfortunately we don't have that gift. Based on the evidence above there are multiple scenarios how it all plays out. From rallying straight back to highs in a V-bottom, to violent volatile swings, or months of range bound action. So far the playbook most resembles the 1998 market. It is never easy but if that precedent holds we should expect more gains in the months ahead.