Sunday, December 27, 2015

Week In Review (12/21 - 12/25)

Even though Santa seems to not be in much of a cheery mood toward the market this year, we hope that your Christmas and holiday season have been full of laughs, fun and family.

As was probably anticipated, the holiday-shortened week was rather boring and quiet which is likely what allowed the S&P 500 to drift higher by 2.7%.

When the index closed at mid-day on Thursday it had just barely stepped into positive territory for the year and now sits up 0.1%.


The rally in stocks was fueled in large part by energy-related names as the price of oil jumped 10% over the course of the week.  This helped the XLE lead all S&P sector ETFs this week in what was virtually across-the-board strong performance.


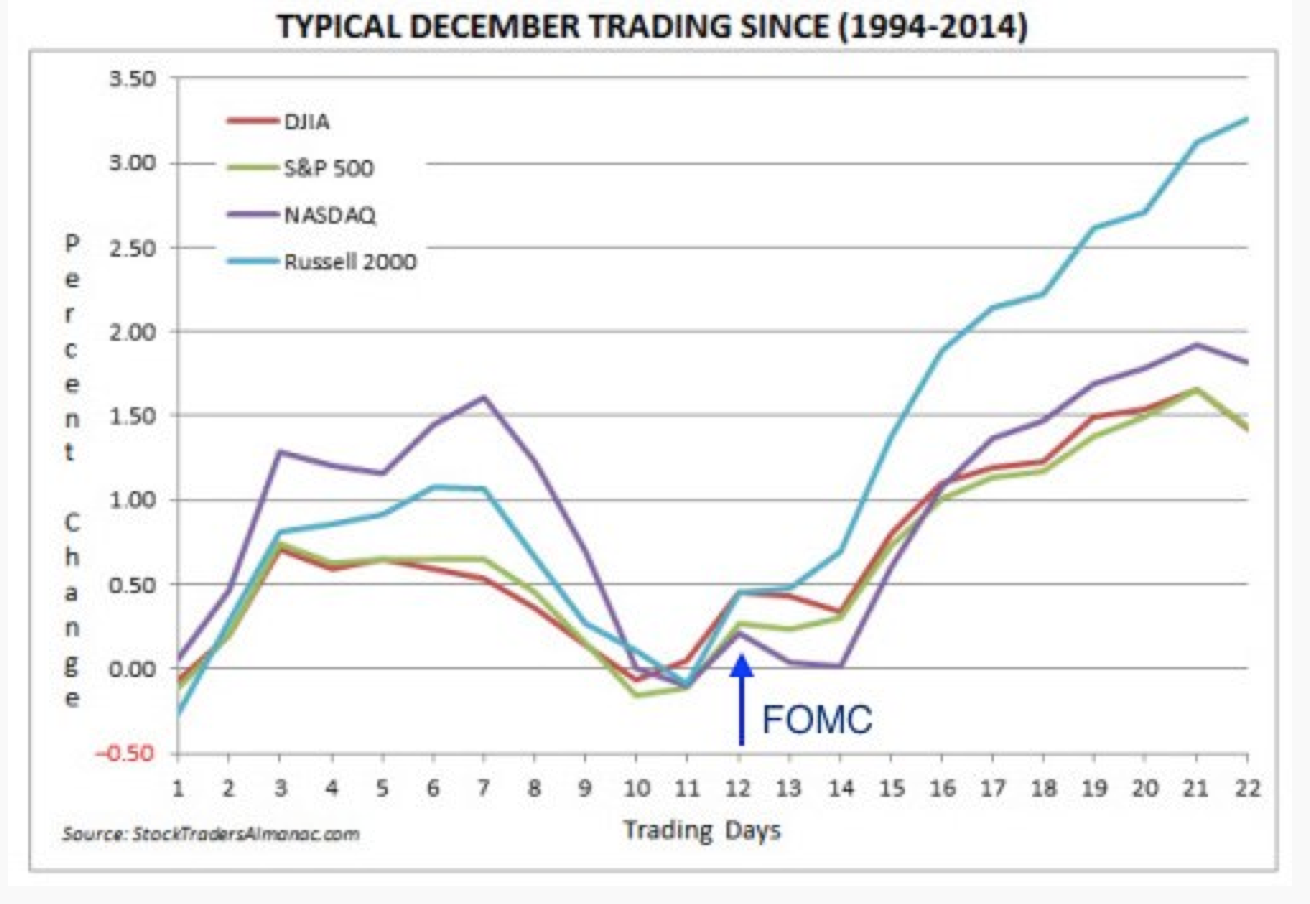
We're likely in store for a similarly quiet environment next week as there are just 4 trading days and Thursday marks the final day of 2015.  While December has historically been a very bullish month for the market, people often associate the notion of the Santa Rally with the entire month.  However, Ryan Detrick's work and the work of others, has gone to show that the "true" Santa Rally (if there is such a thing) typically starts on December 24th and carries through the 2nd trading day of the following January. 


Detrick did a ton of other work on this topic and December seasonality in general.  Find that here.

Have a great week and a wonderful new years.  We'll see you in 2016.

Sunday, December 20, 2015

Week In Review (12/14 - 12/18)

It was a tale of two halves this week as the market rallied nearly 3% from Monday through Wednesday before succumbing to the volatility that has become all to familiar in recent weeks.  Stocks surged early in the week as investors looked ready to cheer the Federal Reserve's decision to raise interest rates by 25 basis points.  And this seemed to be confirmed after the Fed's Wednesday afternoon announcement that sent stocks higher by nearly 1.5% on the day.  However, Thursday and Friday presented an entirely different scenario as stocks dropped 3.3% from Wednesday's close as the attention appeared to turn to oil's continued collapse.

All told, the S&P 500 was down 0.3% for the week while the Dow Jones Industrial Average and the Nasdaq were down 0.8% and 0.2%, respectively.


The Nasdaq is now the only major domestic index that sits in positive territory on a year to date basis.  It has returned 3.95% in 2015 while the Dow, S&P 500 and the Russell 2000 are all in decidedly in the negative.


The market now seems to be intimately focused on the price action in oil and the impact that may ultimately have on the already troubled high yield aka "junk" bond market.  As the distressed debt market grew larger and larger over the life of this QE to infinity market, the risk of default contagion grew along with it.  Now, with prices in oil/energy and other commodity related sectors (metals/mining) at or near Great Recession crisis levels, there is a real fear that these debt markets could lock up.  

With that fear in the air, stocks have fallen victim to increased selling pressure as asset managers can easily target them to raise cash given their liquid features.
 

The weekly ratio chart below depicting Consumer Discretionary stocks vs Consumer Staples helps to show the defensive posture that the market has taken over the last several weeks.  There was a failed breakout and now a set-up for a potential move lower in this ratio exists.


With 8 trading sessions left in the year, there continues to be no sign of a Santa Rally in store for 2015 but we'll see if this year has shades of 2011 or perhaps very optimistically 1991...We won't hold our breath.


Here are some of our favorite links from the week past:


Thursday, December 17, 2015

Themes of 2015

With the year coming to a close, we've been running an inventory of the events, topics and themes that swayed the market over the course of the year.  To be sure, this list is by no means comprehensive but we felt these were some of the "ingredients" that contributed to what turned out to be a frustrating year for most.

  • Volatility Comes Back
    • 2015 saw surges in volatility that had not been seen since 2011. Particularly the August - September timeframe. Which is no surprise why 2015 has been the most challenging year since 2011.


  • The plunge in crude oil and many other commodities
    • Oil’s drop in 2015 wreaked havoc on energy-related stocks, emerging market economies, the high yield bond market, MLPs, etc.


  • Emerging Markets Sink
    • As referenced above, emerging markets investing was a minefield this year as commodity-producing economies suffered slowdowns.


  • Currencies & US Dollar Strength
    • The dollar displayed continued strength as major economies around the world sought to fight off recession by introducing additional monetary easing policies.
    • China, in a surprise move, devalued the yuan as they fought to stem their slowing economy

  • Flat Market Hides Underlying Volatility
    • While the market is flat for the year, 65% of the S&P 500 has moved at least 10%.  145 stocks are up more than 10% while 178 are down more than 10% (according to S&P’s Howard Silverblatt)

  • Stock Selection / Breadth
    • FANG stocks (Facebook, Amazon, Netflix, Google)
    • The year was all about being in the right names as breadth was incredibly narrow.
    • The 10 largest stocks in the S&P 500 are up an average of 21% YTD.  The other 490 are down an average of -2.5%.  The largest such spread since the bursting of the tech-boom bubble.

  • Trannies Weakness
    • Transports lagged significantly which served as a drag on overall market performance.  The ratio chart below showing Transports : S&P 500 tells the story.


  • Fed and Pullback of QE
    • The FED finally moved on rates yesterday. The quarter-percent move was debated, predicted and picked apart for the entire year.
    • This article from MarketWatch shows how various asset classes performed leading up to, during and after previous rate hike cycles.  History suggests that the S&P has typically slipped a bit once rates begin to rise but then assumes an upward bias as the cycle continues on.

  • Greece Debt Crisis
    • Dominated headlines the first half of the year and ultimately a crisis was avoided with yet another bailout.  However the damage was already done as the Greece stock market is down roughly 70% from its peak and down 25% ytd. 
 
  • Geopolitics - Russia, Syria, ISIS/Terrorism
    • Terrorism, both here and abroad, reared its ugly head with attacks occurring throughout the year. Meanwhile the civil war in Syria and chaos in the Middle East has resulted in mass migration across all of Europe.


  • Healthcare Shakedown
    • As the political season heated up, the healthcare industry came under scrutiny on a variety of fronts.  Valeant (VRX) plunged almost 74% peak to trough this year as it was the poster child for political outrage.  

Sunday, December 13, 2015

Week In Review (12/7 - 12/11)

It was a brutal week for stocks as every major US index fell more than 3% and things ended on a particularly woeful note as the S&P 500 lost 1.9% and the Nasdaq shed 2.2% on Friday alone.

This week's weakness has brought the S&P 500 back into negative territory for 2015 with just 13 trading days left in the year.


One of the primary catalysts to stocks being sold off this week is the drama unfolding in the high yield bond market.  High yield credit spreads have continued to widen over the course of the year and we're seeing this spillover into the equity markets in the form of increased volatility.  As the distress in the credit markets has grown and defaults mount, the equity markets are coming to the realization that such occurrences often coincide with recessionary periods.  That risk coupled with the Fed's anticipated rate hike announcement next week has definitely shaken investor confidence.

The following charts and comments from JP Morgan show just how ominous this situation could become especially if it expands beyond the energy sector.

Further compounding the problems in the junk bond space is the much publicized trouble that certain funds are facing.  Third Avenue Management has decided to liquidate one its high yield strategies (Third Avenue Focused Credit Fund) and will not allow investor withdrawals as this process unwinds.  This announcement kicked up fear in other bond funds and as a result the iShares iBoxx High Yield Corporate ETF (HYG) had its worst one day performance since 2011 on Friday which caused it to close at its lowest price since July 2009.

All told, it simply was not a good week for price action or sentiment and we could very well have more volatility in store next week in the lead up to the Fed's announcement on the 16th.  In fact, according to James DePorre of realmoney.com, tomorrow's action may require things to get a bit worse before they get better.


We'll see if this chart from the Stock Trader's Almanac has any predictive power in how the remainder of the year plays out.  Have a good week.


Wednesday, December 9, 2015

Correction Through Time?

The S&P 500 closed at 2,059.82 on December 9th, 2014.  One year later, the index sits almost exactly at that same level and has done nothing but frustrate investors over the course of the last 12-months.  Unless you were fortunate enough to hold a select few stocks that have outperformed over that time, you've likely spent the year fighting to just tread water.

With the market's sideways behavior in mind, we've often asked the question of if we're looking at a correction by way of time instead of price.  While the market did indeed have a 12% pullback in August-September, it has not come close to the classic 20% correction that typically signifies a "bear" market and end of a current "bull."

This line of thinking, and it's in no way original to us, supposes that the 12-months of sideways consolidation could be just a pause that ultimately allows the market to propel much higher and we continue on in this secular bull trend.

We'd counter that there are plenty of reasons to be bearish here.  There's no shortage of fundamental, technical, or quantitative data available to back up a narrative of potential weakness.  However, if you take out all of the "noise" and just look at price and trends, they tell an interesting story.  The most important area to focus on will be 2,134 which would make new highs in the S&P.  If that area can be breached to the upside, the current choppy action will be remembered as a pause in an overall bull market.

Further, a few quick things our research found:
  • Going back to 1920 the average bear market lasts 12.43 months. 
  • Current sideways consolidation is approaching 12 months (Does this count for anything? Are we getting our correction through time instead of price?).
  • Average bull market lasts 28.50 months.
  • This consolidation comes after a 2 year run straight up from late 2012.  Looks somewhat similar to the 2011 market "pause."


Doug Short has a nice recap on the history of secular bulls and bears and his data suggests that we're in for more "up" if we are indeed in a secular bull.  On average, the secular bull phases of the market have gained far more than the current move off the 2009 bottom (inflation adjusted).

Secular Trends


Sunday, December 6, 2015

Week In Review (11/30 - 12/4)

Friday's broad rally in stocks repaired the damage done on Wednesday (S&P 500 down 1.1%) and Thursday (S&P down 1.4%) and the S&P was able to finish the week with a slight gain of 0.1%.  The S&P surged 2.1% on Friday as the market seemed to signal an "OK" to an increasingly likely move by the Federal Reserve after the November employment report came in just slightly higher than expected.  This stood in stark contrast to Thursday's market action where traders sold-off stocks after the latest European Central Bank policy announcement was viewed as underwhelming.

While big caps managed to finish the week with slight gains, small cap stocks were not able to keep pace as the Russell 2000 lagged and finished the week down 1.6%.


With 4 trading weeks left in 2015, here's where the domestic indexes stand:


As has been the story for most of the year, the Nasdaq has been the only source of returns for the US stock market.

We're sure you've seen plenty of year-end / "Santa rally"-type commentary over the last week so we'll resist from saying too much.  Steve Deppe, of Nerad & Deppe Wealth Management, offered up some interesting observations on the typical December and they became more compelling as the week unfolded.  He said:

"Since 1950, the calendar month of December has closed higher 75.38% of the time with average returns of 1.67% (using the S&P 500 as a proxy). The average monthly draw up for December the last 65 years, as defined by measuring December’s high from November’s close, is 3.22%. With Monday’s close at 2,080.41, this would target a December high of 2,147.39.

If history is any guide, it’s reasonable to expect new all time highs in December.

Will these highs demonstrate sustainability? That’s the trillion-dollar question. December’s average drawdown, as defined by measuring December’s low from November’s close, is -2.24%. However, the median December drawdown is just -1.28%.  Normalized December weakness would target a December low anywhere from 2,033 to 2,053. A pullback to this price level is not a reason to call a top, panic, or think the next correction is underway."

The market's lows on Thursday and Friday fell squarely into Deppe's suggested range of 2,033 - 2,053 for a "normal" pullback that could be expected at some point this month.  If history holds in this case, the lows for the month may be in and the market could be looking to challenge all-time highs before year-end.