Tuesday, October 18, 2016

Some notes from the latest BofA Merrill Lynch Global Fund Manager Survey

Bank of America / Merrill Lynch just released its monthly global fund manager survey for October.  The report itself is always loaded with valuable insights and below we highlight just a few:
  • Fund manager cash levels jumped to their highest mark since post-Brexit and November 2001 (post 9/11 attacks).  Higher even than at the height of the financial crisis.
  • Managers are rotating out of areas that have most benefitted from ZIRP (bonds, REITs, healthcare) and into banks, insurance, equities, commodities, and EM

  • According to the managers polled, the 3 most crowded trades are Long high-quality stocks, Long Investment Grade Corporate bonds, and minimum volatility strategies
  • The biggest equity driver the next 6 months by a wide margin will be....Treasury bond yields

  • Biggest tail risks currently out there are EU disintegration, a crash in the bond market, Republican wins the White House, and US inflation

  • Fund managers' current allocation to equities improves but still remains 0.7 standard deviations below its long term average

From a contrarian perspective, the high levels of cash should continue to act as a potential tailwind for higher equity prices as the stocks climb the "wall of worry."  Clearly there has been a shift and rotation in terms of asset class emphasis based on the expectation that higher interest rates are near.  Lastly, there are several potential "tail risks" out there that managers remain wary of.  The upcoming US presidential election is one of those risks and we'll see how that resolves in just a few weeks.

Monday, October 10, 2016

October and Beyond

A quick look at historical market performance in October and where things stand in terms of sentiment:

The chart below shows the average behavior for the S&P 500 in October over the last 20 years.  We've typically seen the index find its low for the month around the 9th or 10th and then proceed to finish October higher by an average of almost 2%.


As we noted in our last blog, October ranks as the best month for stocks over the last 20 years and kicks off the seasonally positive 4th quarter window as November ranks 3rd in strength and December comes in at 5th.  However, while October has been the strongest performing month over this timeframe it also carries the highest standard deviation of any month.


And looking back to 1950, while October's standard deviation rank still shows it as the most volatile month of the year, its average return falls to just 7th best.


So obviously, equity market performance in recent October's has come in quite positively.  Couple that with an environment where sentiment remains in check and we could be setting up for more positive performance.  For instance, the CNN Fear & Greed index (composed of 7 different inputs) currently sits in neutral after checking in at "fear" levels a month ago.


Meanwhile, we're currently seeing a rotation into small caps as advisors/investors may be positioning for the next leg up in this bull market.

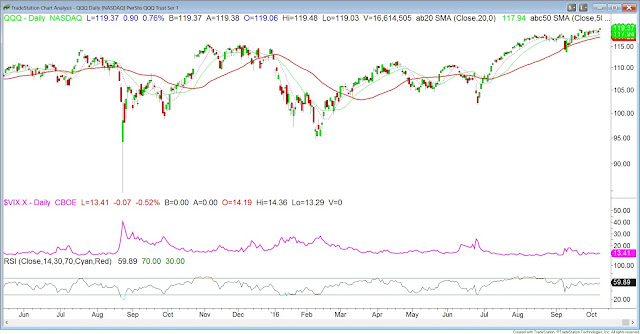
From a relative strength perspective, growth remains the place to be as the NDX 100 continues to hit new highs.

We've got earnings season, the ever dramatic presidential race and the potential of Fed action between now and year-end.  According to the stats shown above, a pick-up in volatility at some point in October would not come as a surprise.