Thursday, December 8, 2016

The Bulls Have Taken Control: Can They Keep It?

As we noted in our last last postthe post-Trump rally has been accompanied by a huge thrust in breadth.  The signals we noted in that post suggested that the recent action was indicative of some notably bullish outcomes looking out 3-6 months and beyond.  If we considered just the stats, it was a screaming buy signal.


Yet, given the environment and market action of the last two years, many investors have felt a bit gun-shy (perhaps, rightfully so) to step in and buy here.  Not only have they been humbled by a choppy, mean-reverting market since late 2014, they’ve also been forced to consider the ramifications of the likely Fed rate hike that we’ll be seeing in a few days.  Is it fully priced in?  What’s the reaction going into year-end? Are we moving from a QE induced bull market into an earnings driven bull market as analysts like Raymond James' Jeff Saut has been proclaiming for some time now?

"Students of stock market history will recall secular bull markets tend to have three legs. If Mr. Tuey is correct, we are barely into the second leg of this bull market, which as previously stated, he thinks is going to be, “The longest and strongest leg of all.” Of course that “foots” with our thinking that there is at least another seven to eight years left in this secular bull market. In fact, Tom Lee, sagacious captain of FundStrat, recently published a chart showing the potential for this “bull” to extend into the 2029-2034 timeframe. That seems a touch long to us, but heck, if that’s what the markets give us, we will certainly take it! I did find Tuey’s closing comments, in Gary Lamphier’s article, intriguing: “The second key point is that for the past 100 years or more, the more severe the economic downturn, the more powerful and enduring is the subsequent bull market. When you’re faced with financial Armageddon as the U.S. was back in 2008, the Fed eases much more aggressively than ever before, and they stay accommodative for much longer than normal.”
To be sure, all of this fits with our thesis the equity markets are transitioning from an interest rate-driven to an earnings-driven secular bull market. To that point, many of y’all know we are on an email “string” with folks like Arthur Cashin, David Kotok, Dennis Gartman, Bob Pisani, etc. It is a freewheeling exchange of thoughts that provides very interesting insights. Last Thursday, the savvy Bob Pisani wrote this:
President-elect Trump's proposed nominee for U.S. Treasury Secretary, Steven Mnuchin, said on our air yesterday that the administration was still targeting a reduction in the corporate tax rate from 35% to 15%. The current 2017 estimate for the entire S&P 500 is roughly $131 per share. Thompson estimates that every 1 percentage point reduction in the corporate tax rate could "hypothetically" add $1.31 to 2017 earnings. So do the math: if there is a full 20 percentage point reduction in the tax rate (from 35% to 15%), that's $1.31 x 20 = $26.20. That implies an increase in earnings of close to 20%, or $157. What does that mean for stock prices? The S&P is currently trading at a multiple (PE ratio) of 17, high by historical standards. Applying that 17 multiple to earnings of $157, we get a price on the S&P 500 of roughly 2,669 for 2017. That is 469 points or roughly 20% above where it is today.
Our sense is the new administration will not be able to get the corporate tax rate down to 15%, but even at a 25% rate, it implies an additional $13.10 to the S&P 500’s bottom up operating earnings number ($1.31 x 10 = $13.10). Using Bob’s same math produces an earnings estimate of $144.10, and at 17 times earnings, it renders a price objective of roughly 2450 for the S&P 500.
The equity markets have rallied hard on the belief in a pro-growth administration, reduced regulation, lower taxes, increased infrastructure spending, a reset on trade toward the benefit of American companies, and the reflation trade. If this optimistic scenario comes to fruition, the Penn-Wharton Budget Model targets between a 1.1% and 1.7% increase in GDP growth beginning in 2018. If true, GDP growth could ramp to ~3%+, suggesting stocks are not all that expensive. Verily, we have never wavered on the belief that we remain in a secular bull market. Such bull markets typically last for 14-15 years and tend to compound at around 16% per year. If past is prelude, we should have another seven-plus years in this “bull run.” Will there be pullbacks? Of course there will be, but pullbacks should be viewed within the construct of a secular bull market." 
For those that have mustered the courage to aggressively buy this rally, they’ve also been afforded some ripe opportunity to outperform through stock-picking.  We track the daily correlation of the underlying S&P sectors and our data shows the measure falling to its lowest level since August and before that late-2014.  Taken a step further, the data is also borne out by the clear divergence in performance for said sectors.  Being positioned in financials, energy, industrial, and materials has well outperformed laggards like utilities, consumer staples, technology, and health care over the last month.


Also favoring the bulls, was yesterday's major push higher in the number of stocks on the NYSE making new 52-week highs.  The tally was the highest reading since 2013 and according to Nautilus Research it marks a significant technical feat and confirmation that bullish conditions are afoot.  Their findings show that when the S&P 500 makes a new high and is accompanied by a new high in the 52-week individual stock reading (as happened yesterday), the market continues higher.  Going back to 1990, this setup has occurred 16 times and in every instance the S&P has been higher one year later by an average of nearly 15%.


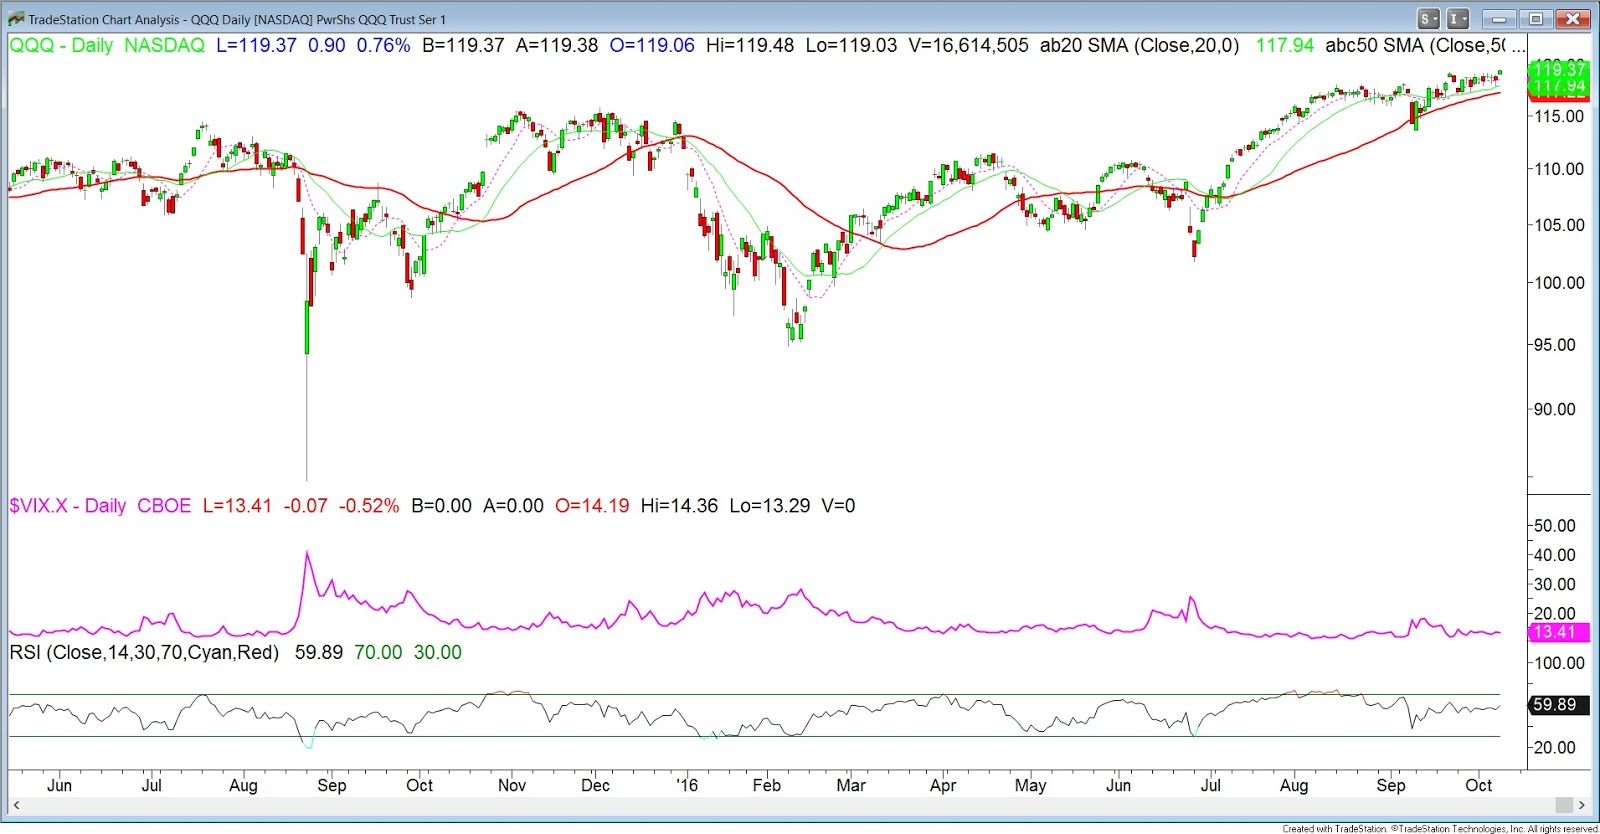
We are aware that this market is now overbought on multiple short-term conditions.  Also in the last few years the above indicator has been a good tell for potential short term tops and bottoms.  So if nothing has changed and we're still in the same environment of the last two years, then we could be closing in on a near-term top.  

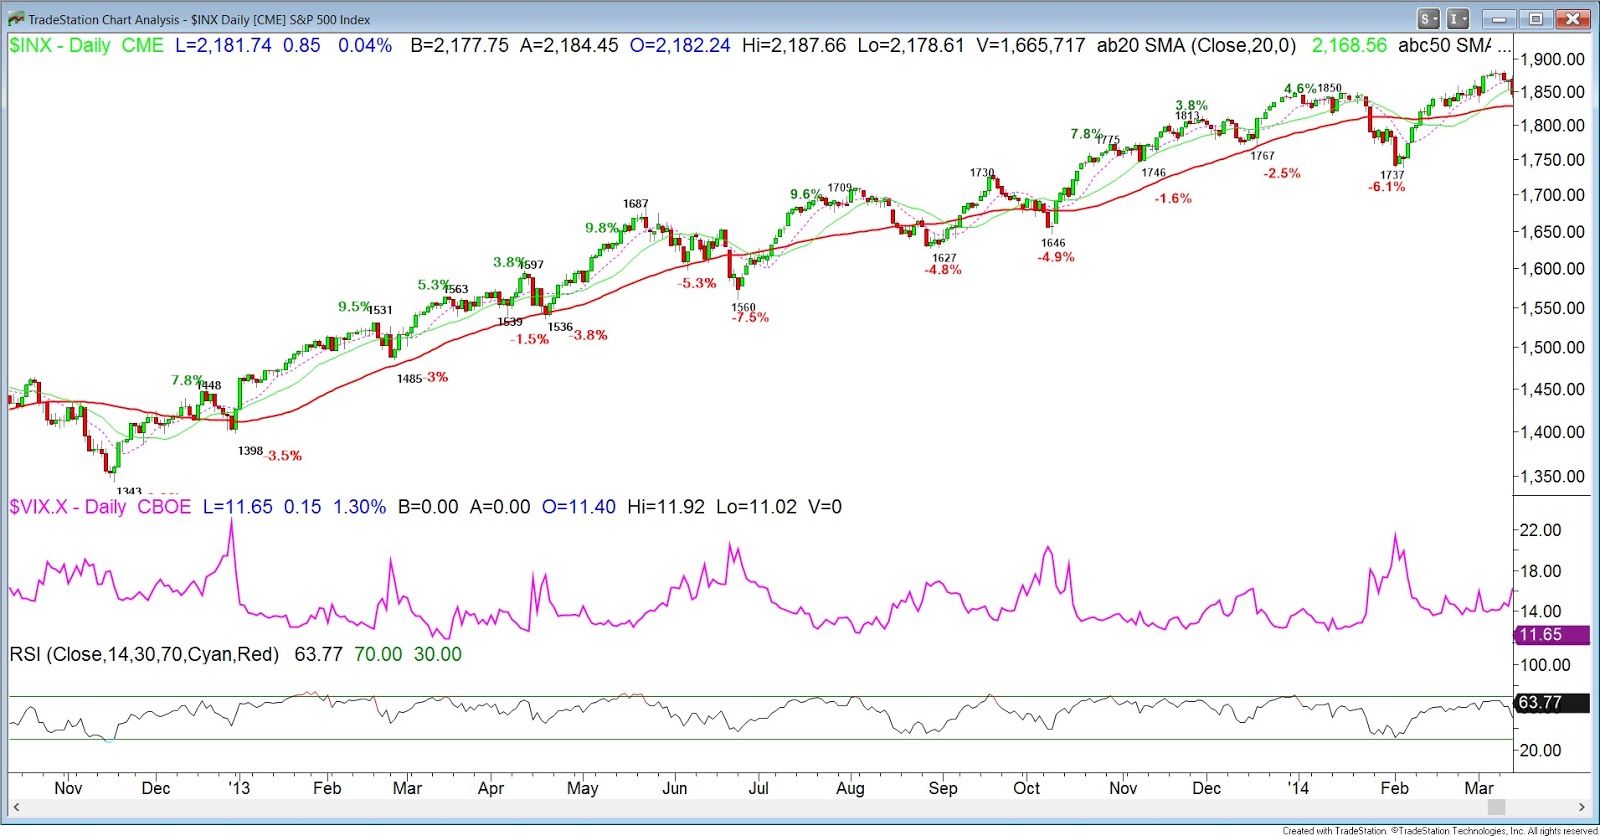
However if we are entering a new market environment in which a trend can be sustained ala 2013, we can be confident in sticking with the trend and going in search of bigger profits.  If this is the case, and we are entering an earnings driven market the argument for active management could be coming back into vogue.

Wednesday, November 16, 2016

Promising Breadth Readings Last Week

The market action of the last week has been nothing short of remarkable.  From the election night futures plunge to its immediate reversal and the rally that followed, it's fair to assume that a number of traders and investors were left wrong-footed at one point or another.

Yet for those that positioned for a Trump-win rally, they've been all smiles over the last several trading days.  Today we wanted to look at recent market breadth.  By most measures the move over the last 5 days has been incredibly broad.  From the number of stocks at 52-week highs, to the % of stocks above a certain moving average, to A/D lines, to high/low ratios, all have shown solid breadth thrusts since last week. 

One other breadth reading we track on a daily basis is the number of stocks up 4%+ on the day accompanied with volume.  This unique measure provides clues into how much participation is really happening during a given price move.  Our universe covers roughly 5,000 publicly listed U.S. stocks and the reading we got on this measure last Wednesday (11/9/16) really grabbed our attention as it was the highest recording (by our count) since 2011.

This prompted us to go back into recent history and look for similar examples on this measure and see what happened in their wake.  We went back to 2010 and searched for readings where the number of stocks up 4%+ on a given day was greater than 600. *(We excluded 2009 since the readings off the financial crisis market bottom were too powerful.  We also removed clusters where multiple instances occurred within any 5 trading day span)*


Conclusions:
  • Significant edge especially going out 3-6 months
  • Every time-period experienced a sell-off prior to thrust except the first signal in Jan 2010
  • 2010 & 2011 very different environments from 2012, 2013, and 2016
  • 2012 and 2013 are most similar to current thrust considering proximity to new highs and prior shallow pullbacks
2010

2011

2012-2013

2016

Tuesday, November 8, 2016

Yesterday's Big Gap-Up Was Worth Noting

After falling for nine consecutive sessions, the S&P 500 put an emphatic end to that streak yesterday by gaining 2.2%.  The rally was sparked on Sunday evening in the futures market after FBI Director James Comey told lawmakers that, after a review of new emails, Hillary Clinton should not face criminal charges.  The market celebrated the news and by Monday morning, the S&P was set to gap higher by nearly 1.5%.

Given the nine day losing skid, the market went into last weekend approaching some fairly notable oversold levels.  And while a near-term bounce could have been expected, it's unlikely that too many of us were predicting the huge bounce we saw on Monday.

The recent market action nudged us to go in search of prior instances where we saw big gap-up openings in the SPY after reaching oversold levels.  One study we ran looked for gap-ups of at least 1% while the 14-day RSI on the SPY was in oversold territory (< 30) at the close of the prior trading day.

Observations (going back to SPY inception in 1993):
  • Returns going out 3-months after a signal are incredibly favorable.  This trade offers an "edge"
  • Yesterday was only the 19th occurrence since 1993.  We anticipated more.
  • Almost all of these instances occurred during periods with elevated volatility
  • Rarely did it mark the final bottom for the market during that particular period
  • However, we did note that a tradable bottom wasn't far off in many cases
  • Yesterday's signal was the first ever to occur within 5% of all-time highs (Friday's close at 2,085 is 4.95% from the all-time high of 2,193)


Below are some of the periods shown above:

2015-2016

2011

2007

2001

1996

Tuesday, November 1, 2016

October Recap - Stocks Weaken to Kick Off Q4

Equity markets saw some deterioration over the final few weeks of October as US stocks slid back to the bottom of their post-Brexit range.  The S&P 500 finished the month down nearly 2% while the Russell 2000 really took a hit, down almost 5%.  This was a departure from recent history as October had been the best month for stocks over the last 20 years with the S&P returning more than 2% on average and finishing higher 70% of the time.


Much has been made of the weakness in small caps over the last month and rightfully so as they (and micro caps) were the biggest losers in October.  However if we take a longer-term view, we can gain some valuable perspective.  The ratio chart of the IWM vs SPY has been in a well defined channel since 2013.  It recently tested the top of this range and was due for a potential reversion.


Some other things of note that took place during the month:
  • 10 yr yields are up almost 20% from the September lows
    • Regarding yields -are secular lows in?  Nice positive divergence with room to run before a potential test of the upper boundary (long-term chart below).
  • Financials and Utilities were the only two positive S&P sector performers during the month.
  • The Dollar looks set to rally to the top of its 2 year range (chart below)

Additionally:
  • Real Estate and REITs down 7-8% for the month
  • Biotechs underperformed - down 8+%
  • Metals were very weak with miners down 10+%
Very generally, much of the sector performance can be attributed to the strength in yields as that is positive for financials but not so much for real estate.  Meanwhile, the dollar's strength has put pressure on metals.

Also, considering the strength in the dollar and the huge move in yields we would have expected to see relative weakness in large caps vs. small caps.  However, the S&P has held up remarkably well all things considered, leading us to believe that a December rate hike is already priced in.  Further, traders could be positioning more defensively ahead of the election by selling more risky small caps and rotating into large cap names.  Robert W. Baird & Co had some insightful commentary on these developments.

Recent action aside, there is a lot of seasonal data that suggests the last two months of the year should be strong.  We recently shared some stats on how favorable recent 4th quarters have been for stocks.
If this is to be, it might make sense for the market to sort've idle in place here until all of the election hysteria has passed.

Equally compelling though are the types of studies shared by Steve Deppe and others that remind us that the S&P still never really "broke out" after making new all-time highs in the summer.  In fact, if you really drill down into the numbers, Deppe shows us that the S&P reached an all-time high of 2,093 all the way back in December of 2014.  October 2016 finished with the S&P at 2,126, just 1.5% above the high made nearly two years ago.  Deppe has a point when he suggests that the S&P just needs to "prove it" at this point.

Tuesday, October 18, 2016

Some notes from the latest BofA Merrill Lynch Global Fund Manager Survey

Bank of America / Merrill Lynch just released its monthly global fund manager survey for October.  The report itself is always loaded with valuable insights and below we highlight just a few:
  • Fund manager cash levels jumped to their highest mark since post-Brexit and November 2001 (post 9/11 attacks).  Higher even than at the height of the financial crisis.
  • Managers are rotating out of areas that have most benefitted from ZIRP (bonds, REITs, healthcare) and into banks, insurance, equities, commodities, and EM

  • According to the managers polled, the 3 most crowded trades are Long high-quality stocks, Long Investment Grade Corporate bonds, and minimum volatility strategies
  • The biggest equity driver the next 6 months by a wide margin will be....Treasury bond yields

  • Biggest tail risks currently out there are EU disintegration, a crash in the bond market, Republican wins the White House, and US inflation

  • Fund managers' current allocation to equities improves but still remains 0.7 standard deviations below its long term average

From a contrarian perspective, the high levels of cash should continue to act as a potential tailwind for higher equity prices as the stocks climb the "wall of worry."  Clearly there has been a shift and rotation in terms of asset class emphasis based on the expectation that higher interest rates are near.  Lastly, there are several potential "tail risks" out there that managers remain wary of.  The upcoming US presidential election is one of those risks and we'll see how that resolves in just a few weeks.

Monday, October 10, 2016

October and Beyond

A quick look at historical market performance in October and where things stand in terms of sentiment:

The chart below shows the average behavior for the S&P 500 in October over the last 20 years.  We've typically seen the index find its low for the month around the 9th or 10th and then proceed to finish October higher by an average of almost 2%.


As we noted in our last blog, October ranks as the best month for stocks over the last 20 years and kicks off the seasonally positive 4th quarter window as November ranks 3rd in strength and December comes in at 5th.  However, while October has been the strongest performing month over this timeframe it also carries the highest standard deviation of any month.


And looking back to 1950, while October's standard deviation rank still shows it as the most volatile month of the year, its average return falls to just 7th best.


So obviously, equity market performance in recent October's has come in quite positively.  Couple that with an environment where sentiment remains in check and we could be setting up for more positive performance.  For instance, the CNN Fear & Greed index (composed of 7 different inputs) currently sits in neutral after checking in at "fear" levels a month ago.


Meanwhile, we're currently seeing a rotation into small caps as advisors/investors may be positioning for the next leg up in this bull market.

From a relative strength perspective, growth remains the place to be as the NDX 100 continues to hit new highs.

We've got earnings season, the ever dramatic presidential race and the potential of Fed action between now and year-end.  According to the stats shown above, a pick-up in volatility at some point in October would not come as a surprise.

Friday, September 23, 2016

We Got Through August & September, Now What?

As we write this, the S&P 500 sits at 2,170 which happens to be the exact price at which the index finished August and just 3 points below July's closing level of 2,173.

If you've been around the market long enough, you know that the summer months have a tendency to be the market's worst.  Traders go on vacation, volume shrinks and volatility goes up.  In fact, over the last 20 years, August and September have been the two worst months for stocks with August being especially rough.


This year however we've bucked that trend a bit.  In August, the S&P was essentially unchanged and so far in September stocks have bounced back from the mid-month dip to hover back where August ended.  Like a starting pitcher scuffling through the 3, 4 and 5-hitters in a lineup but escaping unscathed, the market is on the verge of wrapping up its seasonally toughest period in perfectly fine fashion.

As of yesterday's close, the S&P was actually above where July finished (2,173) and will go into next week with a great chance of ending the August-September period with positive performance.  With that in mind, we took a look back at the last 20 years to see how similar scenarios had played out.  We found that since 1996, the chances of the market being up from July 31st through the end of September were exactly 50%.  As shown below, in the 10 instances where the market was positive during this period the market went on to post an average gain of 4.15% over the remainder of the year.  Surprisingly enough, when the S&P was down during August-September the index managed to post even higher gains into year-end with an average Q4 return of 6.26%.  That extra performance came with greater volatility though with an average Q4 drawdown during those years of almost -8%.


We then took the study a step further and wondered what the results looked like during years, like 2016 (barring a disaster next week), where the S&P is up year-to-date through September and the results are even more encouraging.  In both cases, the index finishes out the year with better returns and less downside volatility.


With the election coming and the holidays after that, we'll definitely be hearing a lot of seasonality talk between now and year-end but perhaps the results from August and September hold the clues for what's in store the rest of the year...

We'll revisit this post once September has come to a close.

Have a great weekend.


Sunday, August 21, 2016

Week In Review: Checking Sentiment & Breadth

Big cap stocks essentially went nowhere this week as the S&P 500 was down a whopping 1 basis point.  Some of the "risk-on" traits we've recently highlighted continued however as small caps (Russell 2000) showed relative strength and were up 60 basis points over the last 5 days.  All in all, the marketplace still seems to be digesting the fast and furious gains that were made in late June and early July.


With that in mind, we wanted to take a look at some of the forces at play that will determine whether the recent trend continues higher.  In the very near-term, we continue to see some negative divergences and short-term warning signs that will need to be worked off but overall things continue to look healthy for higher prices.  Hopefully any pullback will be similar to some of the past instances shown in our last blog post i.e. shallow and short

Breadth
  • We're seeing some short-term negative divergences as the % of stocks above their 10, 20, and 50 day moving averages peaked out in July (1st chart)
  • Also, the number of 52-week new highs on S&P peaked in July  (2nd chart)
  • Good news is the longer-term looking indicator of % of stocks above their 200-day is hitting highs with the market
  • The advance-decline line is also confirming price strength (A-D line in yellow in 2nd chart).  This is a good thing.


Sentiment
  • Plenty of cash is still on the sidelines as shown by the 5.4% cash weighting of fund manager allocations (this according to the BAML Global Fund Manager Survey).
  • Managers are also only 9% overweight global equities which is almost a full standard deviation below the historical average.
  • CNN Fear and Greed Index is has gotten excessive and is now flashing "extreme greed."
  • AAII survey is at 5 week high but bullishness is still below historical average.  Still very high neutral readings.


AAII Sentiment Survey:

Optimism is at a five-week high, as more than one out of three respondents described themselves as bullish for just the sixth time this year. 

VIX

The VIX term structure remains historically low but as we have shared in previous posts this doesn't necessarily mean we should be ringing alarm bells.


In the short-term there are a few negative divergences worth watching coupled with some sentiment measures being a bit overheated.  This becomes even more important as we enter September which has historically been the worst month of the year.

However, this is also to be expected at the beginning of what could be a new uptrend.  The so-called "wall of worry."  Case in point, according to the monthly BAML fund manager survey, investors are still pessimistic with only 23% of fund managers expecting a stronger economy in the next year. This explains their low allocations to equities and high allocations to cash.  However, the potential for more to hop aboard the bullish thesis could put a healthy bid underneath the market and keep prices propped up.


Sunday, August 14, 2016

The VIX Keeps Going Lower and The Market Higher: How Long Can This Last?

There's been a noticeable pickup in VIX-related talk and headlines over the last few weeks.  Case in point, Bloomberg published this story on Tuesday:


US large cap stocks have essentially jogged in place since mid-July.  In fact, per the Bloomberg article, the "S&P has failed to rise or fall more than 1 percent in either direction for 22 straight days, the longest streak since 2014."  As this sense of relative complacency has overcome the marketplace, the CBOE Volatility Index (VIX) has fallen to a more than two-year low.  At this point with volatility crushed the way it's been, it's fair to ask "what's next?"

We scrolled back into the past in search of similar market environments.  Our general search criteria looked to identify instances where the market trended higher for months and were characterized by declining to flat volatility and persistent overbought conditions as judged by the 14-day RSI.  We also wanted to see the market essentially riding its 20-day moving average higher with max pullbacks being contained and respecting the 50-day moving average.  We wanted the pullbacks to be quick and shallow.

Below are past market periods that exhibited these traits.  We included the S&P's performance over that time and the largest pullback during that stretch:

Dec 1994 - July 1995 27.09% (-2.3%) - After a very narrow 24 month range similar to current market
 
March 2003 - June 2003 28.6% (-5.8%)

July 2006 - Feb 2007 19.4% (-2.4%)

March 2007- June 2007 12.9% (-1.5%)

*Excluded 2009 as it was a huge year and bounce off bear lows and would act as outlier.  Wanted to compare more normal periods.*

Feb 2010 - April 2010 16.9% (-2.3%)

Sept 2010 - Feb 2011 29.4% (-3.3%)

Nov 2011 - April 2012 22.8% (-5.1%)

Jan 2013 - April 2013 14.2% (-3.5%)

Oct 2013 - Jan 2014 12.4% (-2.5%)

Feb 2016 - April 2016 16.6% (-2.8%)

June 2016 - ???

The average move is 20.03% with the average pullback at -3.15%.  The moves lasted between 3 and 8 months.  These results are further supported by a study this week by Mark Hulbert where he evidenced that a low VIX is not necessarily a sign of pending trouble for stocks.


Dr. Brett Steenbarger recently posted yet another great piece about market understanding.  Part of being a successful trader is identifying the current market environment and adapting to the conditions.  Trending markets are very different from choppy markets and the opportunity sets within are not the same.  The most difficult part in this process is identifying inflection points of when we're moving from trending to choppy and vice versa.  As a discretionary trader you have to weigh the evidence presented and make your bets from there.

After 2-years of choppy, range-bound trading the S&P 500 has broken out to the upside and made new all-time highs.  So if we have in fact entered into a trending environment, you'll want to be long the market, searching for relative strength and buying any weakness.  However, pullbacks are likely to be quick and won't give you much time to buy in.

Below are a few examples of the trending periods that we highlighted above.  They show price trending and a flat to declining vix (middle panel).   The 14-period RSI is shown in the bottom panel as price remains overbought throughout the move.

1995

2006-2007

2010

2013

2016