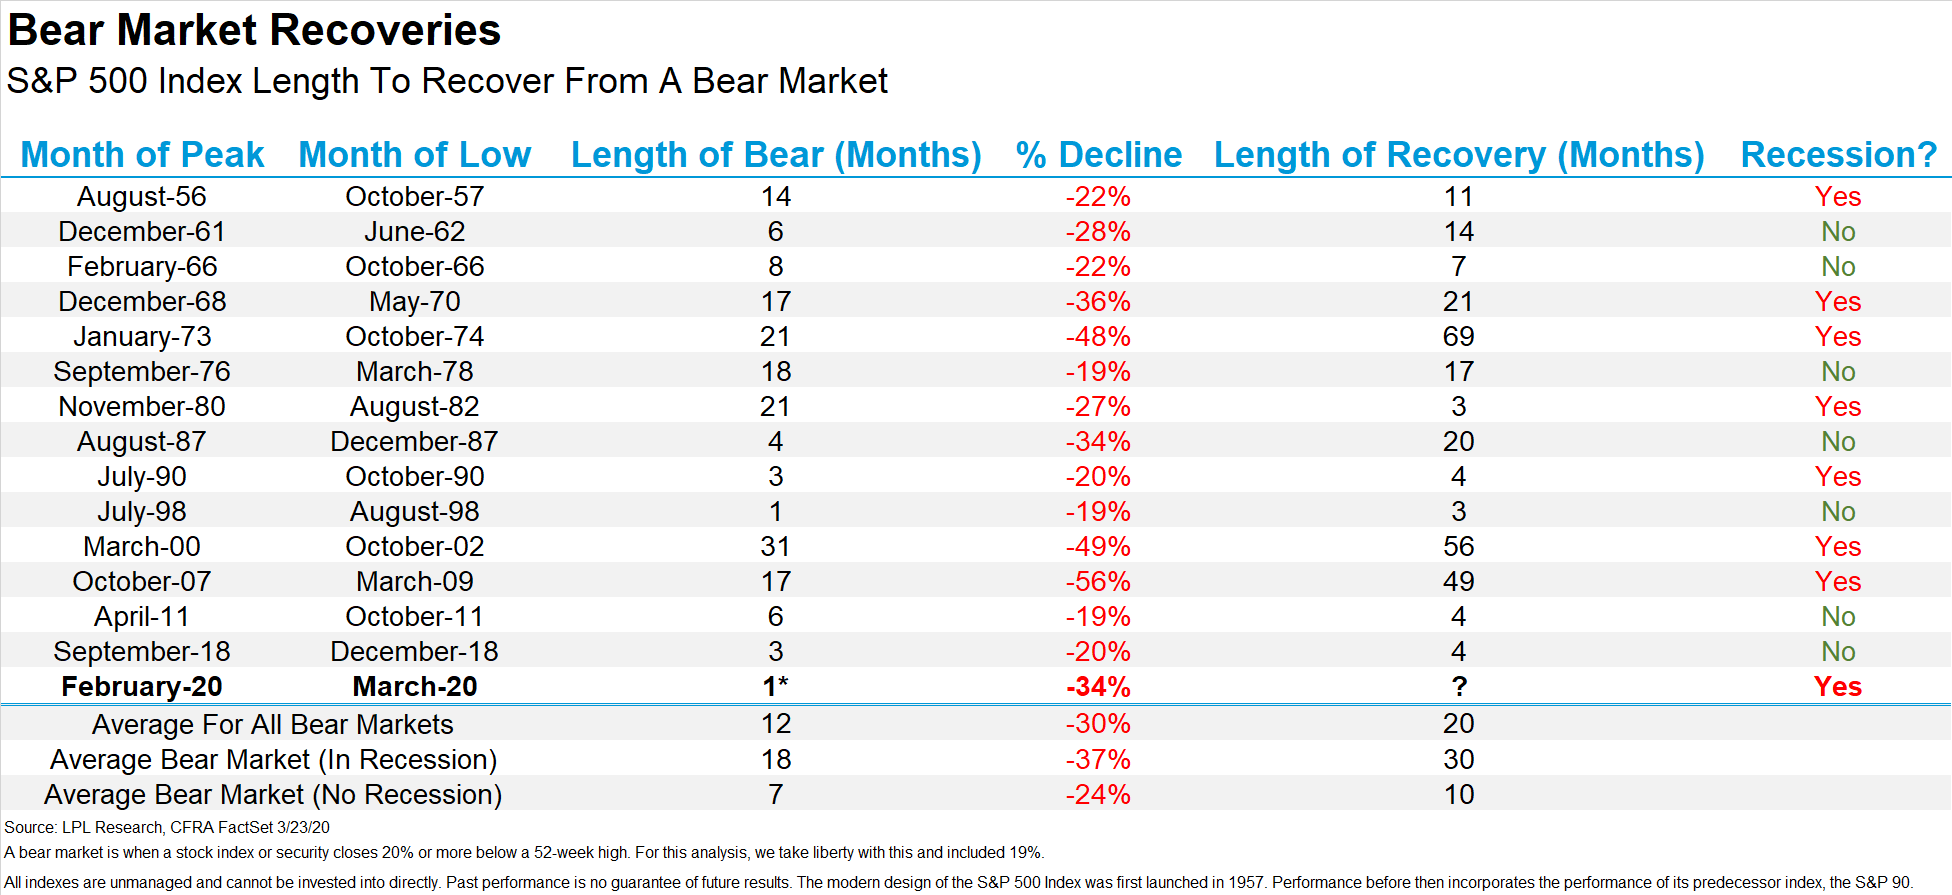
What we have witnessed since the March bottom is nothing sort of remarkable. In the face of the largest pandemic since the early 1900s, stay at home orders, worst economic numbers ever, riots and protest in all major cities, the markets have raced higher just as fast at it collapsed. This has been the fastest transition from a US bull to bear market in history at 16 days for the S&P and 19 days for the DOW, before turning back into a bull market on April 8th. The Nasdaq has hit new highs and the S&P is off just 5.5% from all time highs. This is after both were down greater than 30% just a little over two months ago. Below shows the V-bottom like behavior in the S&P and Nasdaq since the rally began in late March. In fact, the S&P 500 just put in the largest 50-day rate of change going back to the 60s. The next closest was coming off the 2009 bottom. Not even the 90s has such a strong 50 day advance.
50-Day rate of change for current market
2009 50-Day rate of change
1990s 50-Day rate of change

Below shows just how powerful this current rally is as it compares to the greatest rallies of all time.

The one thing that has lacked coming off the bottom has been breadth. The market rallied on the back of narrow leadership that were deemed the winners in the work from home plays. However, as states have slowly started to reopen breadth has exploded and participation is now broad and wide. Currently over 90% of all stocks are trading above their 40 day moving average. Below is a study from Ned Davis that shows the past instances (marked by arrows) where this short-term breadth indicator crossed above 90 after falling to at least 75% in between. Out of the 19 cases, the market was up a year later each time with a median return of 16.28%.

Outside of the reasonable case that the coordinated actions of monetary and fiscal stimulus have turbo charged the rally one less obvious stat caught our attention. An interesting note from Jeffries shows the U.S. has witnessed a cratering in the number of publicly traded companies in the last two decades – a trend that doesn’t seem poised for a rebound in 2020 with capital markets’ activity declining considerably. And while net leverage has crept up from a few years ago, it remains half of what it was in the mid 1990s. Due to the growth of passives, there has also been the knock on effect of higher concentration, with five houses owning, on average and in aggregate, about 20% of many companies in the U.S. Another way of looking at it: if the equity universe were a neighborhood:
• There would be fewer houses
• But these houses would be bigger, on average (by market cap)
• And they would be held by a smaller number of owners
On top of this, sentiment isn't euphoric even after the greatest 50 day move in the S&P. That makes us hopeful for the trend to sustain and the bull to continue. The most recent AAII sentiment survey shows a higher than normal level of bearishness along with below average bullishness. This isn't wild extremes by any measure.
In the short term we don't want to be too aggressive considering we are overbought and have run so far so fast. The 14-day RSI on the S&P just hit overbought levels for the first time since the rally started. This isn't sell signal alone but just makes us aware that the markets are overheated in the short term.
Along the same lines, the put call ratio has collapsed from massive fear to complete complacency. This tweet from David Larew displays the wild swings.

In summary, the current rally has produced a historic move off the bottom and has started to broaden out which is bullish for a sustained advance and new highs. Yet, in the short term we could see some give back considering the overbought nature of the markets and how fast they have run up. The only thing I know is what I don't know. As markets change we will revisit and adjust our plan accordingly. Until then stay safe and healthy.


