Showing posts with label Breadth. Show all posts

Wednesday, August 17, 2022

Is the bear market over?

We would love to know the answer to this question also. Unfortunately, we won't ultimately know until hindsight sets in. How do we try and decide in real time though? The best course of action is to look at what the current data tells us and try to put the probabilities in our favor. Has the character of the market changed and is there evidence that the bear is behind us? Nothing is certain in trading, but to create an edge we need to put the odds on our side. Lets get into it.

Below is a list of all bear market rallies from Milton Berg since 1973. Just one bear market both lasted longer than 37 days and gained more than +14.82%.

For the first time since the Nasdaq topped late last year, the MACD has turned positive during the current rally. 


Based on 12 studies on market breadth done by Chris Ciovacco in his weekly market update, the odds are heavily in favor of the bottom being put in. Based on 61 signals over 12 studies, the low was made in 93.4% of cases. Which means there is a 6.6% chance the market can still make a lower low. 

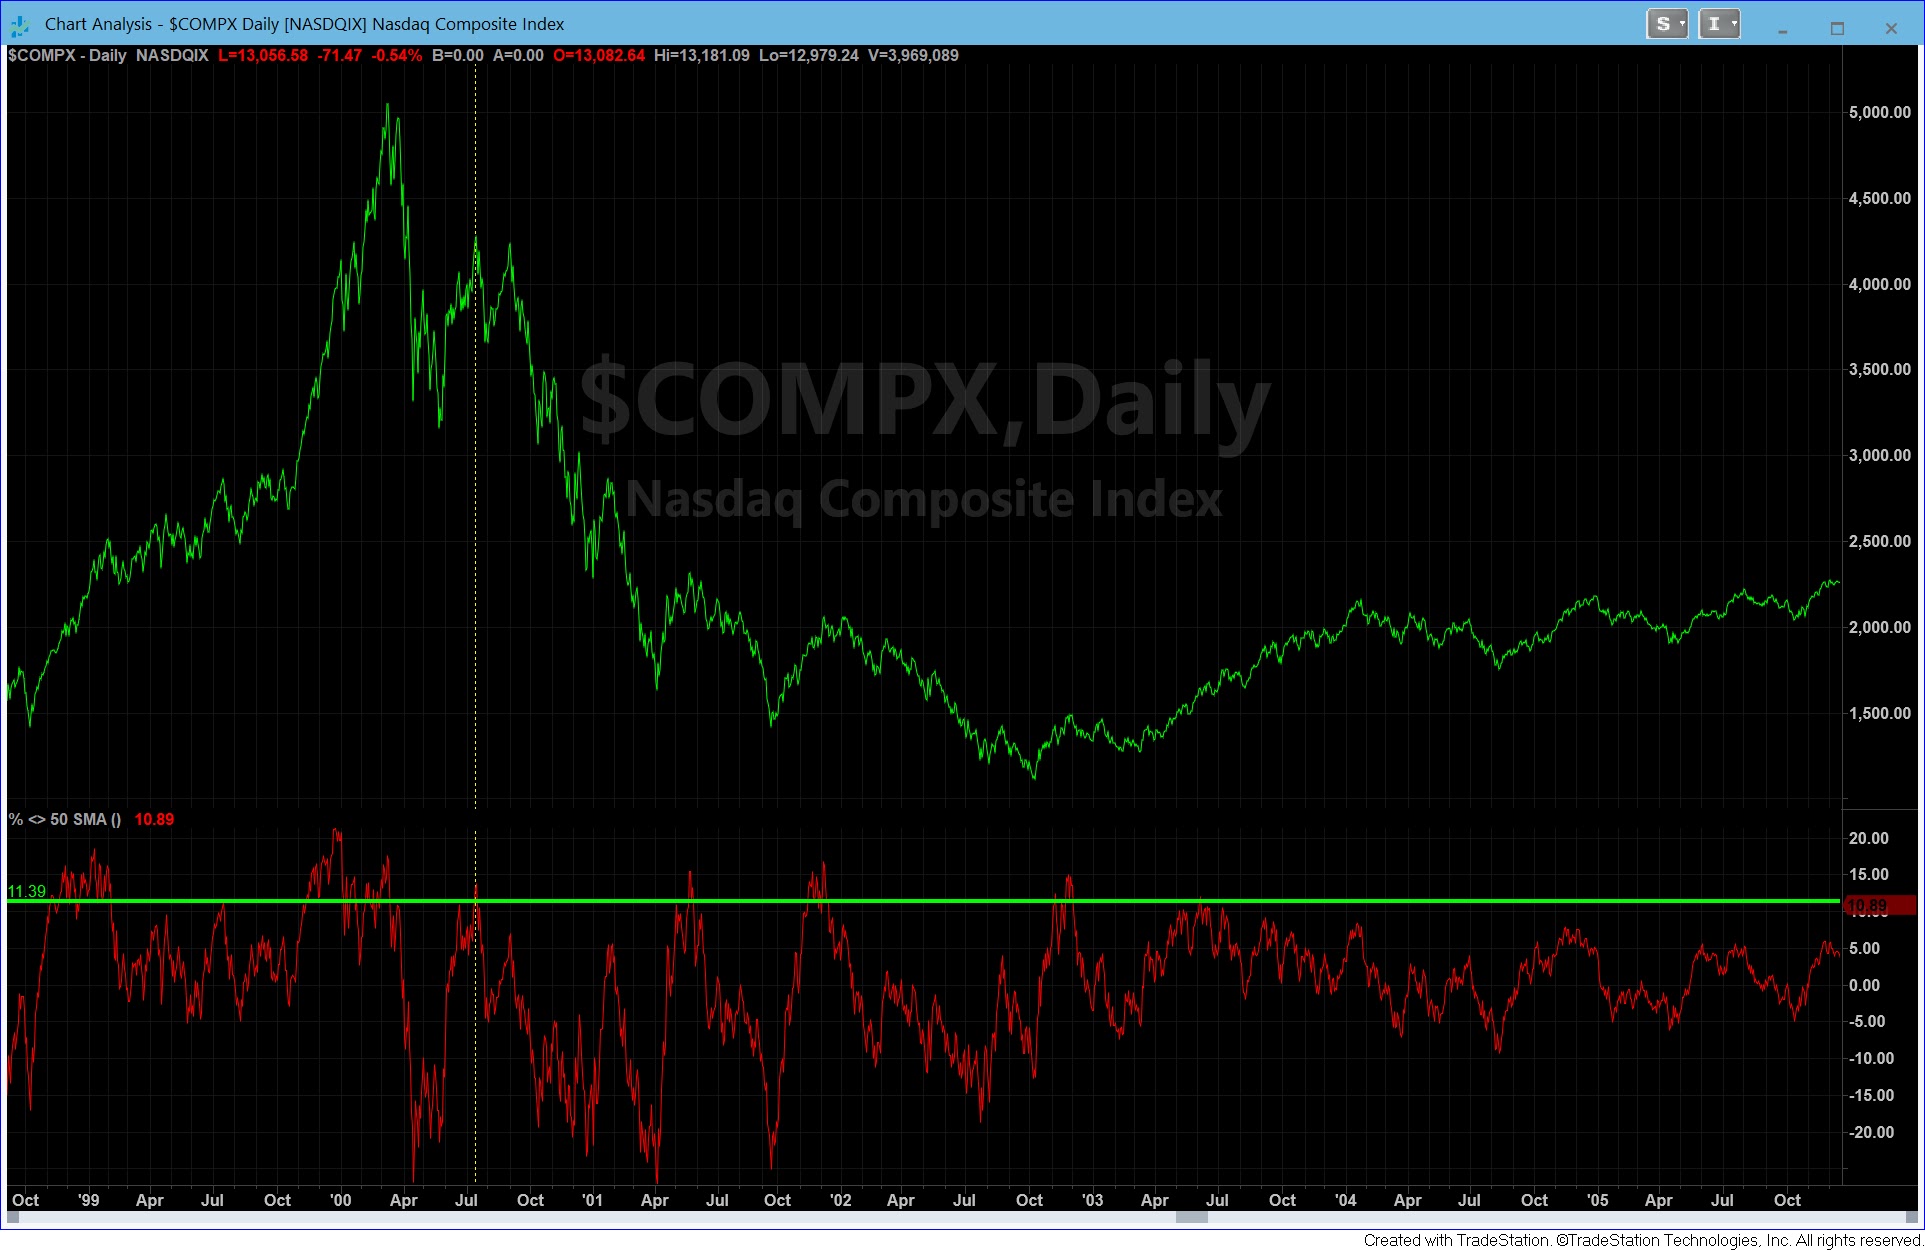
Below is a daily chart of the Nasdaq with the percentage of extension above or below the 50 day. We recently hit levels only hit 3 other times in the last 20 years. 2 out of 3 ended a prior bear market. The 2000 rally was a bear market rally that eventually rolled over.


Another measure of breadth thrust from Jonathan Harrier is favorable to the bulls over the next 12 months. 


Yet, this tweet thread from Jurrien Timmer explains why it is so hard to spot the difference between a bull market and a bear-market rally. If we look at data going back to early 1900s, breadth advances are associated with new bull markets and bear market rallies.  

Breadth readings during new bull markets:

Bear market rallies:


The current rally in the S&P has retraced 50% of its losses from peak to trough. As Jurrien states, "So, on a historical basis, if this rally advances much further, it will be hard to conclude that this is not a new bull market. This is one of the few technical clues out there. If this is a bear-market rally, it likely has gone as far as it will go."

Below is a chart from Ned Davis comparing bear markets depending on whether or not a recession occurred. 

One way we gauge sentiment is the monthly BofA fund manager survey. Below are the key takeaways from the most recent month.


  Cash still remains elevated showing the wall of worry traders still have. 


From a contrarian perspective the % of investors that think the global economy will experience a recession in the next 12 months is the highest since May 2020. The prior peaks were good buying opportunities. 

If we avoid an earnings-led recession but continue to have a valuation reset the outcomes are very different. This is the price analog from Jurrien Timmer that was discussed in our last blog and remains an interesting guide post. 

The evidence favors a market that has bottomed and will continue to climb the wall of worry and rally higher. The wild card remains if we get a bigger and nastier recession and this is nothing more than an extended bear market rally within the context of a longer bear market. A third scenario remains, in which the market has bottomed but finds itself trend-less for an extended period before resuming higher. Even with all the data presented it still remains difficult calling this a new bull market or a bear market rally. At the end of the day we really won't know until it's over what type of bear market this will end up being. What matters most is the price action and right now it favors a strong rally. When the evidence and facts change we will adjust accordingly.



Wednesday, April 27, 2022

When will this market bottom?

Make no mistake, the markets are in a bear market. The technical definition of a bear market is a decline of 20% from the highs. We primarily track four major market indices to get a pulse of the investing landscape. They include the S&P 500, Dow Jones Industrial, Nasdaq, and Russell 2000. As of yesterday's close here is where the four majors stands on draw-downs from prior highs. 

S&P 500       -13.35%

Dow Jones    -10.05%

Nasdaq         -22.95%

Russell 2k    -23.20%

So 50% of the major indices are in bear market territory. Yet beneath the surface there are many more stocks down 20% or greater as the mega caps have held up relatively well. Whether you label this market a bear or not, the fact is it remains an extremely tough market to make money on the long side. Almost the exact opposite from April 2020 to the end of 2021. So the next logical question is, when will this market bottom and become a better trading environment for the bulls?

Lets drill into some detail and facts about the current situation.

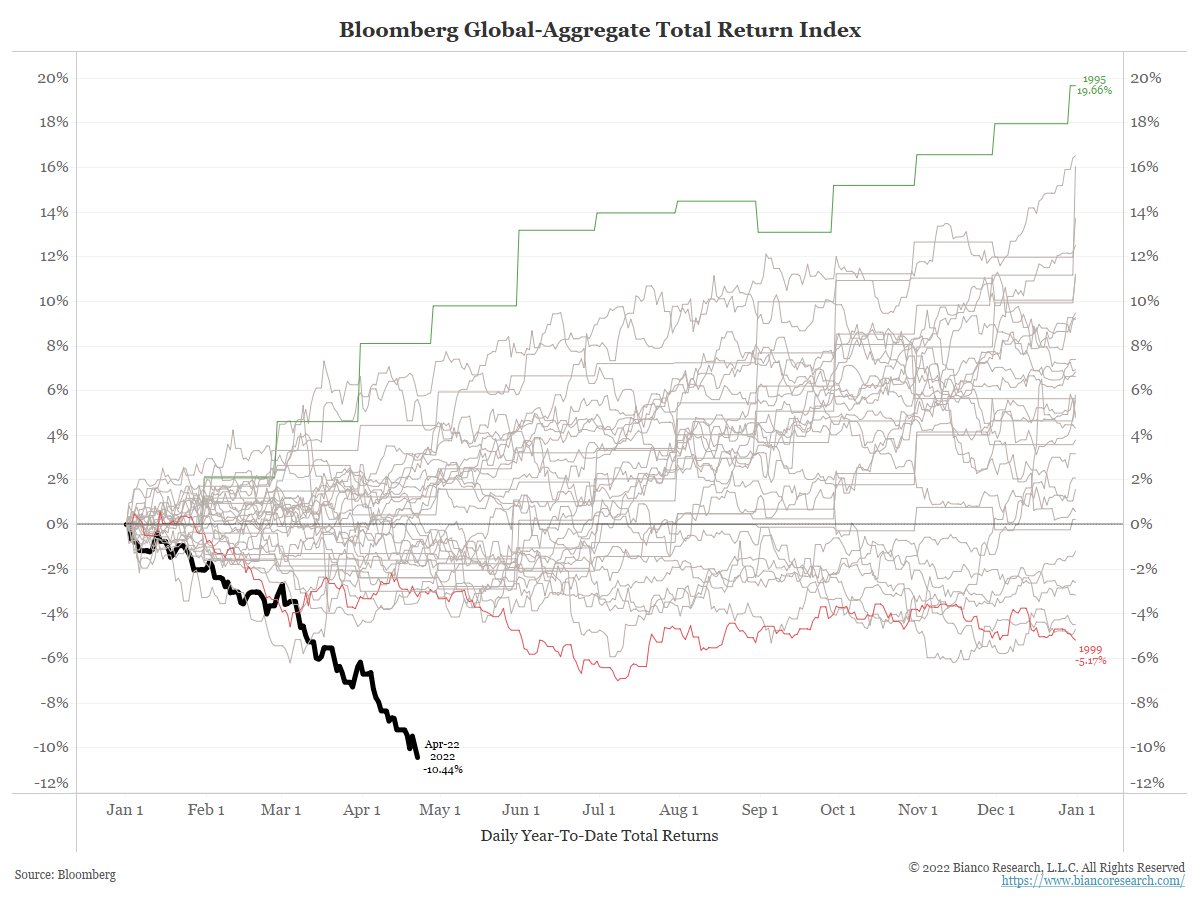
This market has been historically challenging as both stocks and bonds are selling off. A nice chart from Jim Bianco shows the carnage in the bond market year-to-date. 

Image

The S&P is down 13% from the highs. Urban Carmel shows the other times the S&P has fallen > 13% without it becoming a nasty bear market. 

Image

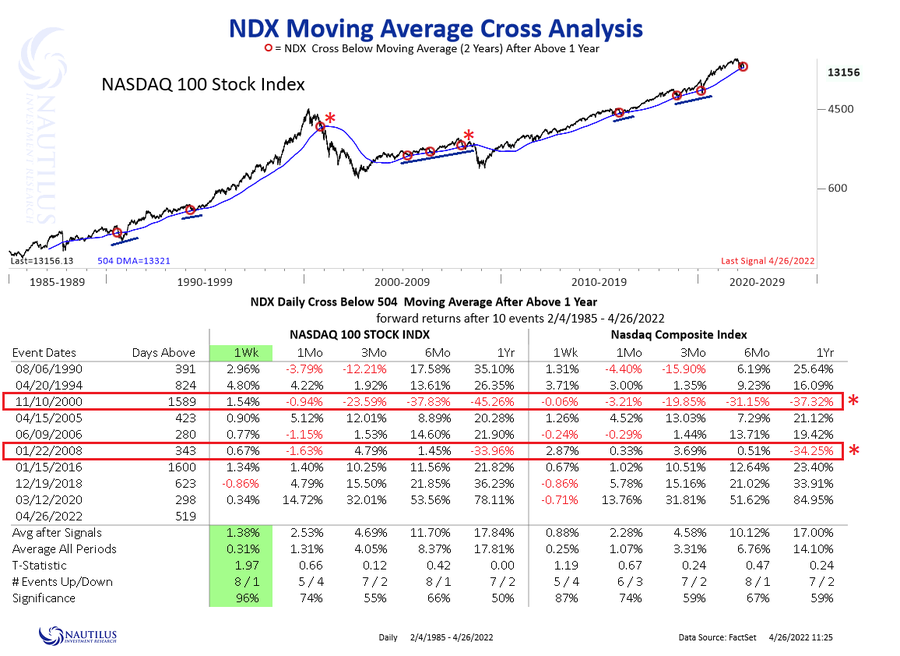
Nautilus Research has a study of the NDX and how returns fare when you get a close below the 2-year moving average after being above it for one year. 

Image

Below is an area of support for the Nasdaq since the GFC. Here the Nasdaq found support at its 40 month exponential moving average during all the pullbacks since the 2008 crash. We aren't there yet but getting close. 

Other areas of support to consider. The Nasdaq has found a bottom when the % of stocks above their 200 day moving average became severely oversold. This threshold has been below the 20 level on four prior occasions since 2010. The 2011 European debt crisis, 2016 growth scare, 2018 taper tantrum, and the 2020 pandemic. Is this time different?


Along with these breadth measures and moving average supports one crucial element the market needs to find a tradable bottom is a blowout in sentiment and fear. As of this moment we haven't seen the level of fear during prior bottoms. During the prior panics since 2009 the VIX has exceeded 45 in each time period. Historically, VIX peaks before price. Is this time different?


Did the actions of the Fed to stem the potential devastation of the pandemic just lead to a massive blow off top? The QQQs had been in a very orderly bull market channel until the massive stimulus injection at the depths of the pandemic. Looks like a retest of the lower channel could be in play. 


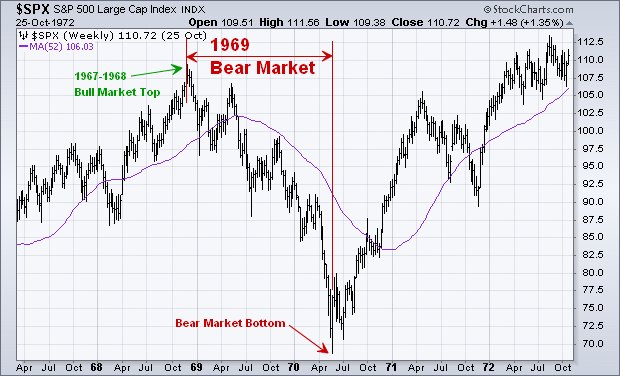
The 1969 bear market may hold some clues to the potential of this decline as the S&P fell 37% from its peak. A great post from Walter Deemer that has some very interesting similarities to the current Fed's position. "In June 1969, Fed Chair William McChesney Martin, referring to the Fed’s thus-far unsuccessful attempts to lower the 6%-plus inflation rate, stated: "We're going to have a good deal of pain and suffering before we can solve these things." 

 Image

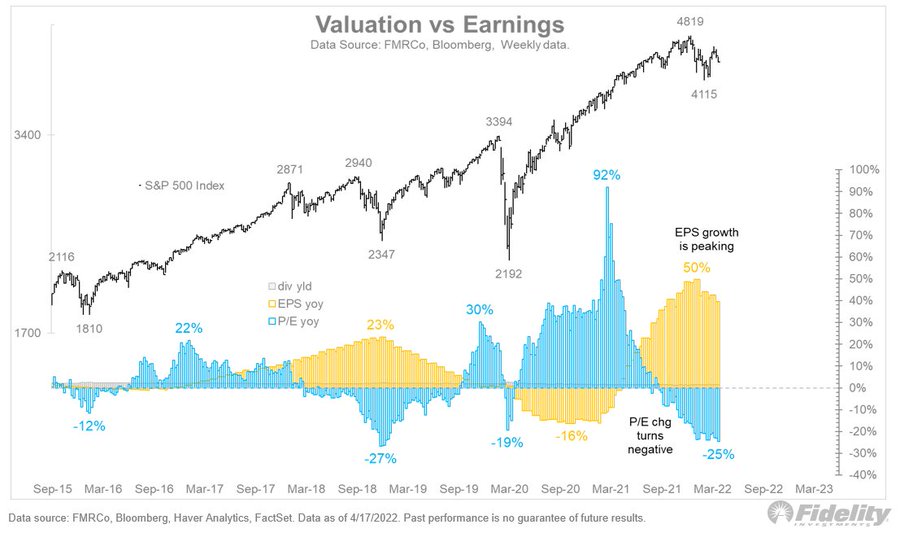
 Jurrien Timmer at Fidelity compares the current Fed tightening cycle, earnings growth deceleration, and multiple compression to the 1994 time frame which saw equities chop around the whole year while suffering a 14% draw-down. In 1994, the Nasdaq finished down 3.2% but endured a ton of volatility and choppy trading. 

Image 


Clearly the poster child for the current bear market has been high valuation growth and represented best by ARKK. So far the ARKK ETF has corrected 68% of highs. During the 2000 tech meltdown the Nasdaq corrected 78% from its March 2000 peak. If the draw down plays out similar, ARKK could see another 33% slide from current prices. It's remarkable how similar they look. 


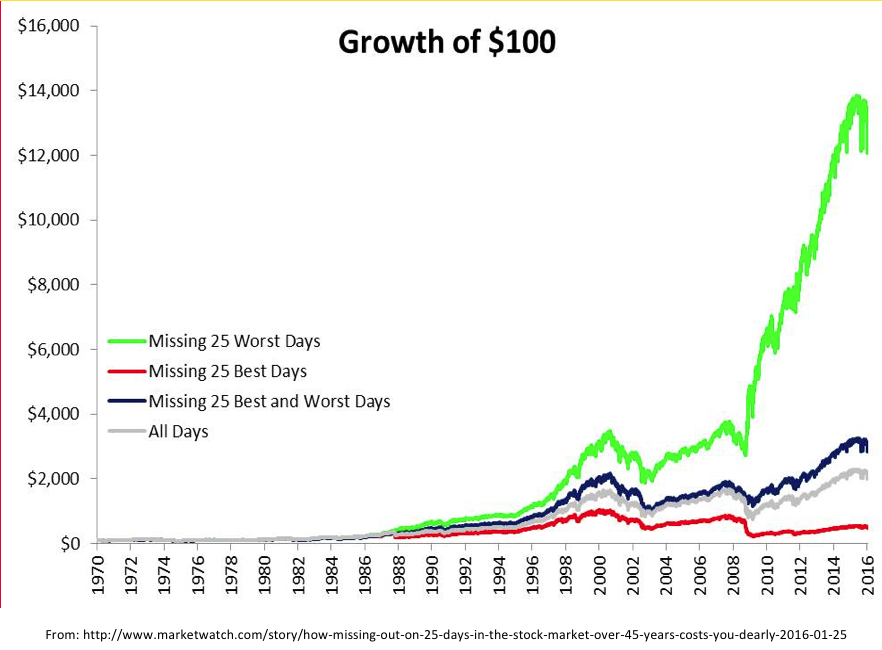
So the big question we have after reviewing the data is: Is this a cyclical run of mill correction/bear market like 2010, 2011, 2016, 2018, 2020, or is this a systemic bear market like 2000 or 2008? I don't know the answer to that in real time and we won't know until it's over. My best guess is it will be somewhere in between with a bigger than 20% correction like 1969 but not a systemic decline like 2000/08. We'll need a spike in the VIX to eventually find a bottom. The great Fed experiment is unwinding and this will take time to undo all the excessive overreach over the last few years. This is why it is so important to be flexible and willing to hold large amounts of cash during a bear market. The last tweet from Dr. Eric Wish  sums it up perfectly; "I am incensed by pundits quoting studies implying not to exit the market because you could miss the best days, when the same studies show one did far better by missing the worst days. Don't be scared into staying in a declining market, unless you have years to recoup losses."


Image


Friday, January 7, 2022

What's in store for 2022

As we embark on 2022 many market pundits are putting out their yearly predictions. We always find these more entertainment and theater rather than actual advice because the honest truth is, no one has any clue what the future holds and the market doesn't care about my opinion. Frankly there are always issues to worry about: Omicron shutdowns, new variant, supply chain glitches, labor shortage, school closures, higher inflation, rate increase cycle, Mid term elections, military conflict, etc. Our investment philosophy isn't predicated on predicting the future but rather reacting to current data. We use current and past data to help shape a thesis for potential outcomes in a scenario analysis manner. Then when events and conditions change we adjust our positioning and risk accordingly. The old adage sums it up perfectly, "the only constant in life is change".

With that said, to look out to next year we need to first assess what has actually taken place in real time. 2021 provided great returns across the asset class spectrum for everything except gold and treasuries. Jurrien Timmer from Fidelity sums this up in his table of investment returns.

Even as the general market provided health returns there was plenty of churn under the surface. Remarkably, the average Nasdaq drawdown from YTD highs is a whopping -42%.

Cathie Wood has taken a lot of heat this year as her Ark funds have under performed. But a simple ratio chart of the ARKK ETF to the SPY shows how dramatic the selling has been in high valuation growth names. ARKK peaked in February and has drastically under performed the S&P since then. Currently it is more than 50% of it's YTD high. 


Most of the destruction in high beta growth can be attributed to the pivot from the Federal Reserve to speed up the tapering process to fight inflation they let get out of control. A tweet from Puru Saxena highlights how expensive stocks have lagged all year when plotted against the Fed's balance sheet.


This begs a bigger question. What is the impact from QE on the markets. Clearly quantitative easing has been a tailwind to the S&P. However, the reversal of QE (tapering) that reduces liquidity in the economy seems to be a headwind. The following two charts from William O'Neil touch on this.

On top of that the Fed's actions have historically triggered greater volatility. 


The following two charts increase the likelihood for the potential for a more volatile environment next year. Low volatile years like 2021 are historically followed by more volatility.


The presidential cycle doesn't do any favors either. The first three quarters are weaker than normal heading into the mid term elections.


One of the biggest market concerns is the rate of inflation and the pace of interest rate hikes from the Fed. However, should we be scared of rate hikes? Bespoke has great data on this. What I found most interesting was, "as shown, the broad market tends to do poorly in the first three month of a tightening cycles over recent year, bu longer-term that's a buying opportunity as forward returns average 7.1% (86% positive) over the first six months follow a rate hike."

Ken Fisher validates this theory that the market shouldn't be spooked by rate hike cycles. Outside of the mid 70's stagflation, equity returns have been positive during rate hike cycles.


Some more data points in the bull case shows how strength begets strength. One of our favorites Ryan Detrick shows what happens after big up years in the S&P 500. The average return next year is 11.6%.


Another interesting stat lies in the fact that 2021 was a unique year. It was only the 5th time in history going back to the 1920's that the S&P finished up double digits three years in a row. We looked at what happened the 4th year after three straight double digit years. The returns surprised us.

Year Yearly Return
1942 12.43%
1943 19.45%
1944 13.80%
1945 30.72%
1949 10.46%
1950 21.56%
1951 16.46%
1952 11.78%
1995 34.11%
1996 20.26%
1997 31.01%
1998 26.67%
2012 13.41%
2013 29.60%
2014 11.39%
2015 -0.73%
2019 28.88%
2020 16.26%
2021 26.89%
2022 ?
Average 4th Yr Returns 17.11%


In conclusion, the data points to a mixed bag and has something for everyone. The bears can highlight tapering and volatility while the bulls can point to continued momentum. Our best guess is the first half will be more volatile than normal with multiple pullbacks. But as the supply chain gets worked out after Omicron dies down that should help inflation ease. Tapering should be done by the first quarter and we should have the first rate hike behind us sometime in the first half. That could set the stage for a second half rally as pent up demand comes on board and a strong finish once the Midterms are behind us. As I said in the beginning, the market doesn't care about my opinion. That is why we prefer to see how the tape reacts to new information and we'll adjust accordingly. 

Happy New Year!

Wednesday, December 1, 2021

Is the Fed going to burst the bubble?

At some point this market will have a bear market and very well could coincide with a rising rate environment. Trying to time or predict when it will happen is fool's gold. What we do know from market history is that pullbacks, corrections, and bear markets are a normal part of investing. A pullback is defined as a decline of 5% to 9.9% and occurs on average 2.5 times a year. Corrections (10% to 19.9% selloffs) happen every one and half years and a bear market (>20% loss) nearly every three years. A study from JP Morgan says the average intra-year drawdown in the S&P 500 is 14.3%.


A good example is 2021 which has been in a sustained bull market. The S&P 500 has experienced two pullbacks in 2021 while maintaining a strong uptrend. Meanwhile, the Nasdaq has been through four such pullbacks this year in what has been characterized as a volatile climate for growth stocks. Trying to rationalize every wiggle in the market is another futile exercise. Regardless of how you calculate the data, selloffs happen and happen more often that thought for various reasons. 

The latest excuse for market weakness: Fed's tapering of liquidity, Omicron variant, debt ceiling, etc. Yet if look back at history to the last taper tantrum in May of 2013 the S&P sold off 5.8% in the next month but rallied 17.5% for the rest of the year. According to Sam Stovall at CFRA Research, "After a very minor pullback known as the 'taper tantrum' stocks took off. Above average market returns across all styles, sectors and up to 80% of all sub-industries. That goes for not only the market rebound after the "tantrum" but the 10-month period that included the actual Fed tapering activity. In the 10-month tapering period, from mid-December 2013 to the end of October 2014, the S&P 500 rose 11.5%, according to CFRA Research. The likely reasoning, Stovall says, is that investors concluded if the economy was strong enough to withstand the removal of supportive bond-buying activity, it was healthy enough to continue to expand on its own."

At Worch Capital, we believe the eventual bear market will be brought on by a move in interest rates or an unpredictable market event outside of the normal business cycle. If history is any guide we should be due for one around the summer of 2022. These numbers are based on averages and can vary wildly. For reference, the longest bull market lasted almost 8 years, so anything is possible. So with all the recent doom and gloom I wanted to look at some data that shows some potentially bullish signals going forward.

While the Federal finances are a mess, consumers are showing an extremely healthy balance sheet as total assets are hitting new highs while personal liabilities are making new lows. 


Charlie Bilello had a recent tweet showing the VIX had the 4th largest one day % increase in its history as it rose 54% on 11/26/21. His key takeaway: "the market tends to rise over time and tends to rise more following volatility spikes (note: on average, there are always exceptions and this latest spike could very well be one).


His data shows the S&P has been higher one year later every single time the VIX has spiked 40% or more. Our own data confirms this, but has one negative period one year later which was in 2007. Below is data on the Nasdaq's performance after a VIX spike of 40% or more. 


 Between the two studies the S&P and Nasdaq average 20%+ returns a year later after a VIX spike.
  

Another study by Ryan Detrick at LPL Research shows "that when stocks are up more than 20% for the year heading into December (like 2021), the final month actually does better, up 1.7% versus 1.5%. Also, it has been higher eight of the past nine times the year was up more than 20% heading into the final month.


One area that we monitor that is worrisome is the massive divergence in breadth. These divergences can last months and sometimes years and most of the time they reverse themselves. But when you get a hard break in the markets accompanied by weak breadth that is usually a time to play more defense than offense. For now the market indices have maintained their up-trends. The weak breath proves how narrow this market remains with a handle of mega caps holding up the indices. Underneath the surface many stocks are well off their 52-week highs. Unless this current turbulence turns into the next bear market (ie: 2018 and 2020) the current weakness is getting very close to oversold levels and where the market has usually found buyers. Below is the % of stocks trading above their 50 day moving average on the Nasdaq. The yellow lines show areas where the market found a low and started to bounce. 

At the end of the day price pays. But the data above gives some comfort to the bulls. It is never easy and sometimes very messy but focusing on fear mongering is not a good strategy. There are always things to worry about in investing. We try and parse the data and come up with a thesis. Yet, when price diverges from that thesis we adjust accordingly.


Monday, February 22, 2021

Crash Imminent?

If you listen to the media they are always taking about the next crash. Based on their track record you have to take it with a grain of salt. Lets look at the actual data and make a more informed decision instead of chasing the next rumor. 

According to the latest BAML survey the only reason to bearish is there is no reason to be bearish. Essentially that means that sentiment is so positive everyone expects the market to continue higher. When fund managers are all positioned in the same direction it often is useful to be a contrarian and play devils advocate. Asking some simple questions and probing the consensus view can keep you from being sucked into the heard mentality. Lets look at the current BAML fund manager survey to see how bullish the current opinions are. 

BofA February Global FMS takeaways

Bottom line: the only reason to be bearish is…there is no reason to be bearish: FMS sentiment on global growth at all-time high, V-shaped recovery finally consensus, cash levels @ 8-year low, equity & commodity allocations highest since '11 (the last year both had negative returns), only 13% say it's a bubble… BofA Bull & Bear Indicator @ 7.7.

Boom-boom: net 91% of investors say stronger economy in 2021, majority now say it's a V-shaped recovery, 1st time since Jan'20 investors want CIO's to "increase capex" rather than "improve balance sheet"; CPI, EPS & yield curve expectations close to record highs.

Cash is trash: FMS cash level down to 3.8%, lowest since Mar'13 (just before Bernanke "taper tantrum"); allocation to stocks & commodities highest since Feb'11; record number investors taking "higher-than-normal" risk.

Risks & crowds: investors view top "tail risks" as vaccine rollout (28%...timing of positive impact has slipped to July), taper tantrum (25%), inflation (24%); "crowded trades" are long tech (35%), long Bitcoin (27%), short dollar (13%).

Cyclical vs tactical: FMS shows cyclical consensus is "cyclical"…high exposure to commodities, EM, industrials, banks relative to past 10 years; but Jan wobble caused investors to top-up "safety of growth" exposure via tech, health care, US stocks.

Anti-Goldilocks contrarian trades: bubble move and/or big inflation in 2021 best played via FMS laggards e.g. energy & UK stocks; conversely longs in EM, commodities, industrials most vulnerable to "peak profits" narrative; either way consumer staples a smart contrarian accumulator in H1.


FMS cash drops to 3.8% from 3.9%, remaining a FMS Cash Rule "sell signal" (back tested 1-month S&P 500 return = -3.2%).


All-time high in investors taking "higher-than-normal" risk now at 25% in February.

FMS investor optimism on cyclical risk assets increases to net 87%, 2nd highest ever (#1 = Feb'11 - last year equity & commodity returns negative). Fund managers are heavily long while expecting inflation to pick up. 

The most recent AAII sentiment survey shows optimism rising to a nine-week high as bullish sentiment is well above its historical average of 38% for the 12th week out of the past 14 weeks. 
 
Based on the current valuation the markets subsequent 1-year returns don't look favorable. But with interest rates artificially low does this change the narrative?  


According to JP Morgan the average intra-year decline is 14% so this is expected.

Yet the market is just coming off a bear market low.

Ryan Detrick highlights how this new bull stacks up against the previous two best starts to a bull market ever ('82 and '09). This one continues to break records, but still be aware the previous two were choppy the next several months.

The chart below is a weekly chart of the Nasdaq and the lower panel is the % above or below the 40 week moving average. Historically, the Nasdaq is extended to the upside. Yet if we look at other times we have hit these levels it has more in common with the earlier stages of a bull market rather than the end. One bit of caution, most of these bull market runs have run into resistance eventually after hitting extremes and experience a deeper pullback. If we look at the 1992, 2004, and 2010 time frames it will give us an idea of what we might expect. The Nasdaq peaked roughly 10 months after the 1991 signal, 4 months after the 2003, and 7 months after the 2009 signal. Each of those periods saw a draw down of: 1991 (-15.5%), 2004 (-18.7%), 2010 (-18.7%).

Below is the ratio chart of high beta vs low volatility. When this chart is going up high beta is leading the market. Until this rolls over expect most pullbacks to be shallow and short.


In summary, sentiment is definitely stretched to the upside and most fund managers are bullish. Alone this isn't bearish but leaves me more cautious in the short term. We should expect a pullback at some point but we expect that pullback to be short, shallow, and bought. The breadth readings are more characteristic of early bull market phases rather than tops and why we don't see this market crashing. However, based on precedent we should see a bigger correction (10%+) further down the road much like 1992, 2004, and 2010. As always we'll continue to stay flexible and nimble and when conditions change we'll be ready to act.