Make no mistake, the markets are in a bear market. The technical definition of a bear market is a decline of 20% from the highs. We primarily track four major market indices to get a pulse of the investing landscape. They include the S&P 500, Dow Jones Industrial, Nasdaq, and Russell 2000. As of yesterday's close here is where the four majors stands on draw-downs from prior highs.
S&P 500 -13.35%
Dow Jones -10.05%
Nasdaq -22.95%
Russell 2k -23.20%
So 50% of the major indices are in bear market territory. Yet beneath the surface there are many more stocks down 20% or greater as the mega caps have held up relatively well. Whether you label this market a bear or not, the fact is it remains an extremely tough market to make money on the long side. Almost the exact opposite from April 2020 to the end of 2021. So the next logical question is, when will this market bottom and become a better trading environment for the bulls?
Lets drill into some detail and facts about the current situation.
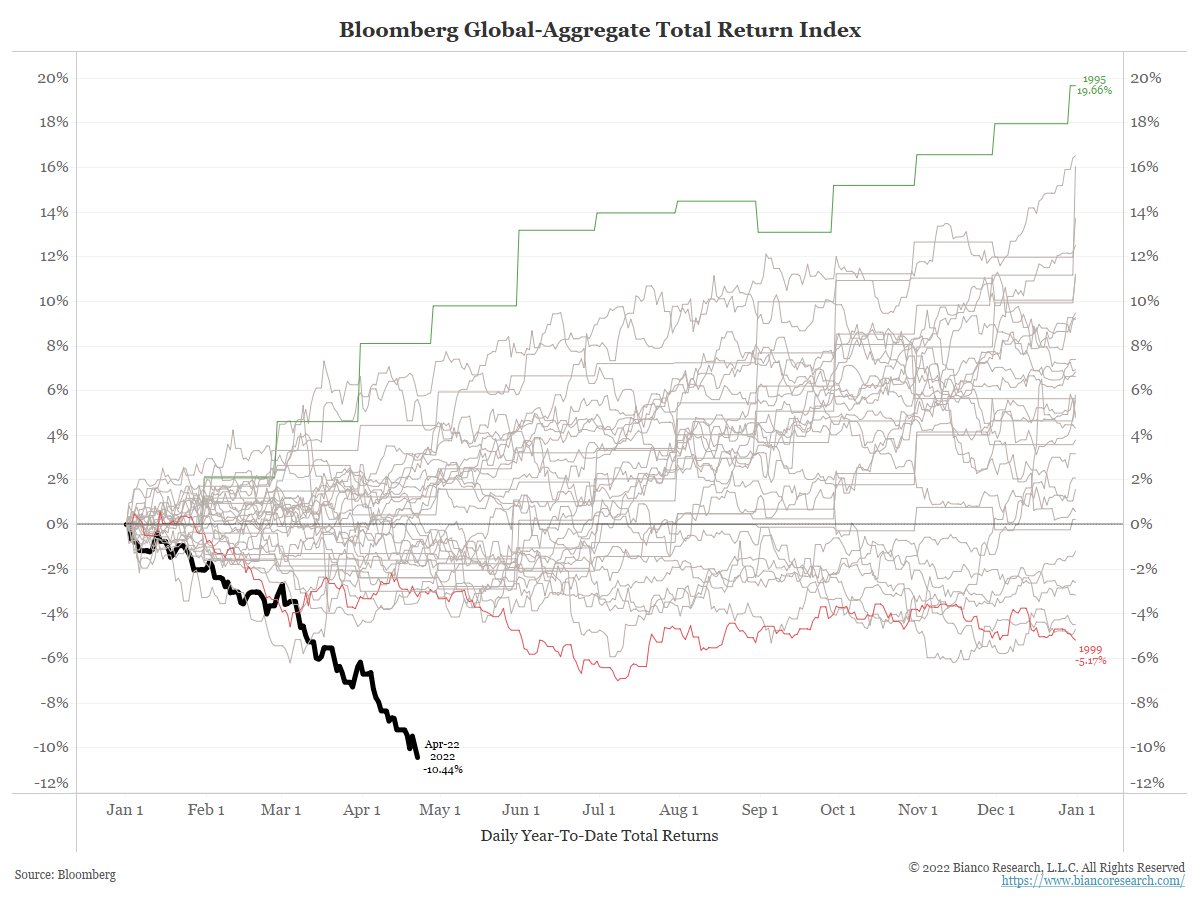
This market has been historically challenging as both stocks and bonds are selling off. A nice chart from Jim Bianco shows the carnage in the bond market year-to-date.
The S&P is down 13% from the highs. Urban Carmel shows the other times the S&P has fallen > 13% without it becoming a nasty bear market.

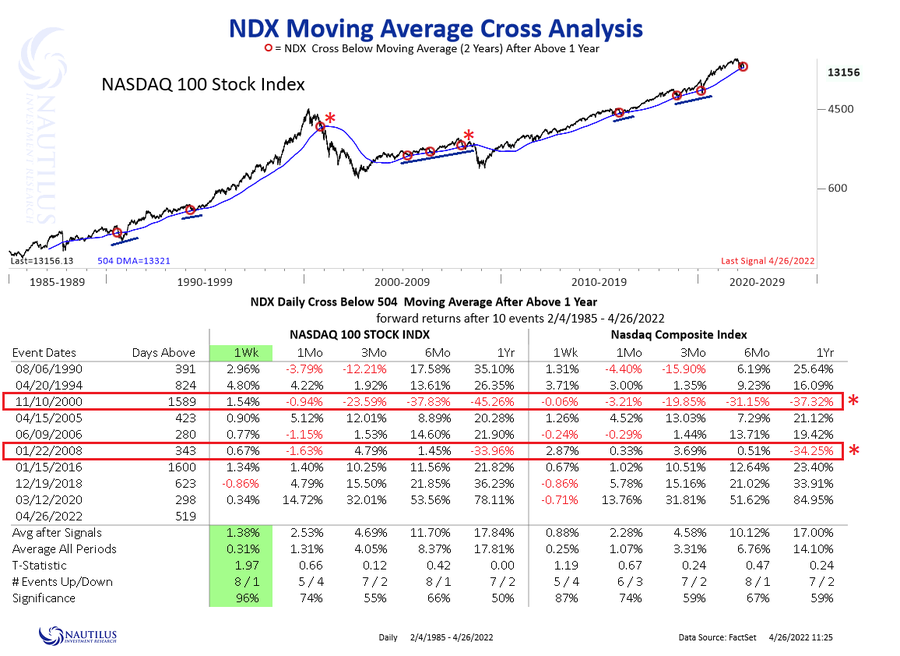
Nautilus Research has a study of the NDX and how returns fare when you get a close below the 2-year moving average after being above it for one year.
Below is an area of support for the Nasdaq since the GFC. Here the Nasdaq found support at its 40 month exponential moving average during all the pullbacks since the 2008 crash. We aren't there yet but getting close.

Other areas of support to consider. The Nasdaq has found a bottom when the % of stocks above their 200 day moving average became severely oversold. This threshold has been below the 20 level on four prior occasions since 2010. The 2011 European debt crisis, 2016 growth scare, 2018 taper tantrum, and the 2020 pandemic. Is this time different?

Along with these breadth measures and moving average supports one crucial element the market needs to find a tradable bottom is a blowout in sentiment and fear. As of this moment we haven't seen the level of fear during prior bottoms. During the prior panics since 2009 the VIX has exceeded 45 in each time period. Historically, VIX peaks before price. Is this time different?


Did the actions of the Fed to stem the potential devastation of the pandemic just lead to a massive blow off top? The QQQs had been in a very orderly bull market channel until the massive stimulus injection at the depths of the pandemic. Looks like a retest of the lower channel could be in play.

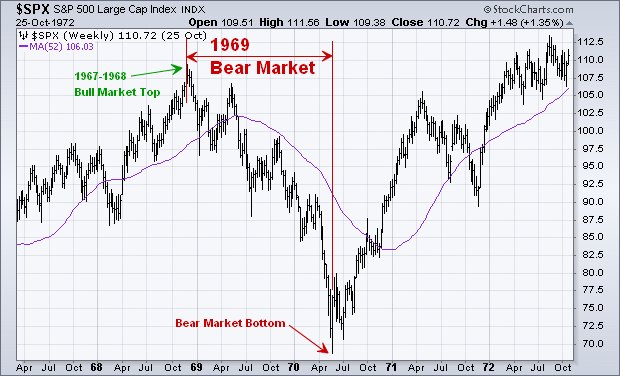
The 1969 bear market may hold some clues to the potential of this decline as the S&P fell 37% from its peak. A great post from Walter Deemer that has some very interesting similarities to the current Fed's position. "In June 1969, Fed Chair William McChesney Martin, referring to the Fed’s thus-far unsuccessful attempts to lower the 6%-plus inflation rate, stated: "We're going to have a good deal of pain and suffering before we can solve these things."
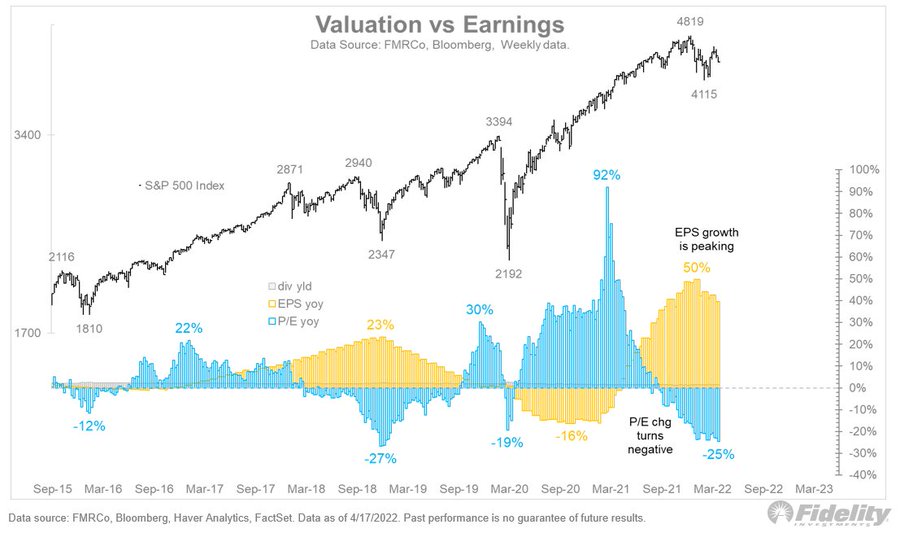
Jurrien Timmer at Fidelity compares the current Fed tightening cycle, earnings growth deceleration, and multiple compression to the 1994 time frame which saw equities chop around the whole year while suffering a 14% draw-down. In 1994, the Nasdaq finished down 3.2% but endured a ton of volatility and choppy trading.

Clearly the poster child for the current bear market has been high valuation growth and represented best by ARKK. So far the ARKK ETF has corrected 68% of highs. During the 2000 tech meltdown the Nasdaq corrected 78% from its March 2000 peak. If the draw down plays out similar, ARKK could see another 33% slide from current prices. It's remarkable how similar they look.


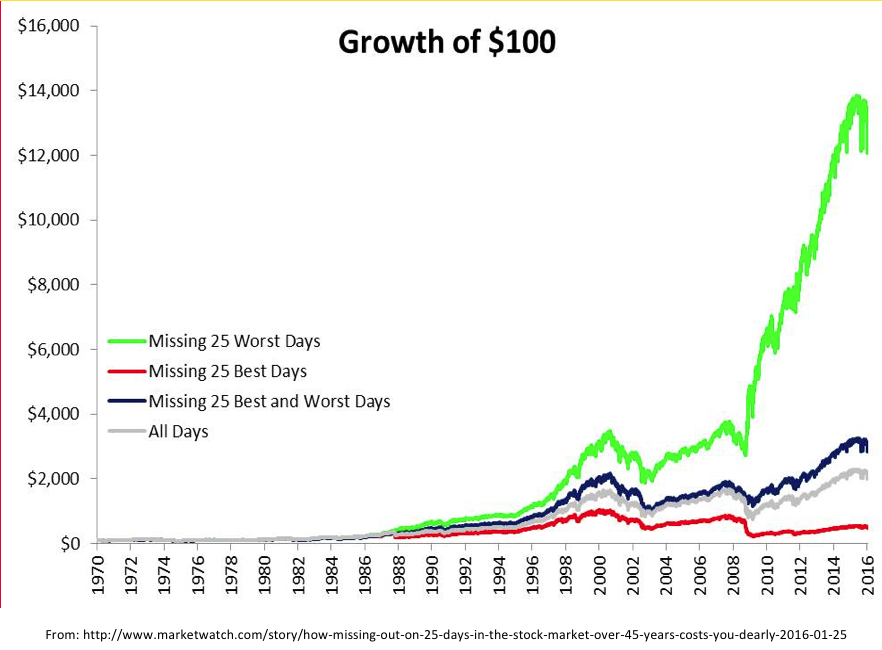
So the big question we have after reviewing the data is: Is this a cyclical run of mill correction/bear market like 2010, 2011, 2016, 2018, 2020, or is this a systemic bear market like 2000 or 2008? I don't know the answer to that in real time and we won't know until it's over. My best guess is it will be somewhere in between with a bigger than 20% correction like 1969 but not a systemic decline like 2000/08. We'll need a spike in the VIX to eventually find a bottom. The great Fed experiment is unwinding and this will take time to undo all the excessive overreach over the last few years. This is why it is so important to be flexible and willing to hold large amounts of cash during a bear market. The last tweet from Dr. Eric Wish sums it up perfectly; "I am incensed by pundits quoting studies implying not to exit the market because you could miss the best days, when the same studies show one did far better by missing the worst days. Don't be scared into staying in a declining market, unless you have years to recoup losses."