Sunday, April 24, 2016

Week In Review (4/18 - 4/22)

US stocks enjoyed another solid week for the most part.  The Dow Jones Industrial Average, S&P 500 and Russell 2000 all saw gains while the NASDAQ slipped as a result of some disappointing earnings reports from companies in the tech-heavy index.  Friday was a particularly rough day for the NASDAQ as it fell 0.8% after GOOGL and MSFT were both hit hard.  Further, tech stocks as a group within the S&P 500 fell 1.9%.  Microsoft fell more than 7% on earnings while Alphabet (Google) dropped 5%.  This caused widespread weakness throughout the index.


This Wall Street Journal graphic showed that the damage was done in these two names by 10:30 Friday morning.


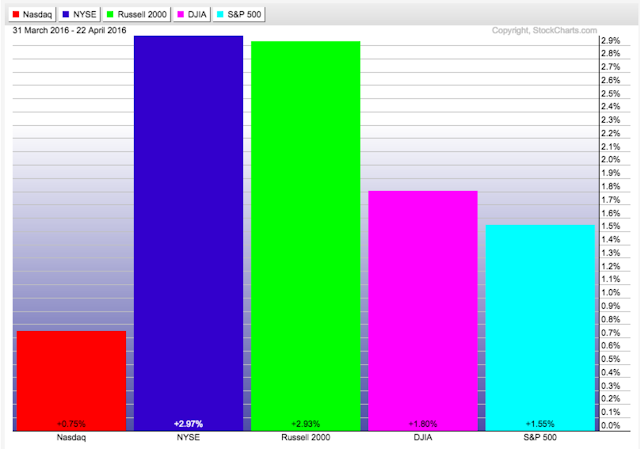
Even with Friday's weakness, the NASDAQ is still up 75 bps in April but remains down 2% in 2016.  Meanwhile, the other major domestic indexes sit in positive territory for both the month and year to date with one more trading week left in historically strong April.

APRIL

2016 YTD

Prior to Friday's weakness, we had tweeted out a chart this week of what appeared to show low volatility stocks slowing down relative to high beta stocks.  We noted a potential trendline breakdown that was suggestive of high beta looking set to outperform.  We're going to keep an eye on this relationship as it will be telling in terms of gauging this environment particularly as we work through earnings.  However, Friday was certainly not an endorsement of high beta taking over.


One thing to note in the tech sector, per Morningstar, is that through the end of March investors had pulled $4.5 billion out of tech focused mutual funds and ETFs.  This after three straight years of inflows.

We're at an interesting point in time right, we're at the tail end of the most favorable seasonal period, we're in the thick of earnings season and, as Steve Deppe (@SJD10304 on Twitter) notes, we have important indexes reaching critical junctures.  Deppe notes that the monthly chart of the Russell 2000 looks primed to re-take its 12 & 20-month movings averages.  This would be a clear sign of "risk-on" and favor further highs in equity markets.


Have a great week.

Sunday, April 17, 2016

Week In Review (4/11/16 - 4/15/16)

After falling more than 1% the week prior, stocks resumed their recent strength this week as the S&P 500 gained 1.6%, the NASDAQ jumped 1.8% and the Russell 2000 really outperformed by advancing 3%.


The relative outperformance in the NASDAQ and Russell were welcomed arrivals as they've been the year-to-date laggards in 2016.  Small caps are now almost at breakeven for the year while the tech-heavy NASDAQ has a bit more work left to do as it's still down 1.4% in 2016.

It's well known that April has historically been one of the market's better months and, so far, this April has been no different.  We looked back over the last 20 years and studied how the market has behaved on average during April.  What we see is that the market, besides being overwhelmingly positive, tends to hit its low point around mid-month and then trends higher into month-end.  We'll see if that holds true this time around.


Bespoke published the charts below at the end of March and it speaks to the indecisive mood of the market.  At that time, S&P had gone 315 days without making a new bull market high.  We're now at 326 days and which makes it the longest streak since this bull started in March 2009.  However, we're nowhere near the longest streak (within a bull market) in market history and an optimist could interpret this as the index taking a rest/pause before resuming higher.


One of the primary causes behind this rangebound market has been the completely lackluster sentiment that's persisted for several months now.  We're now at 24 straight weeks where the AAII Investor Sentiment poll has shown a bullish reading of less than 40%.  The S&P is just a few percentage points from all time highs but bullish sentiment clocked in last week at just 27.8%.


Per the Bespoke chart below, this latest bounce in the S&P has not been accompanied by the type of jump in bullish sentiment that we'd usually expect to see.


Have a great week.

Sunday, April 10, 2016

Week In Review (4/4 - 4/8)

The S&P 500 finished down just over 1% for the trading week which marked the first time since the February bottom where the market did not make a higher high on the weekly chart.


The pullback brought the index back to just about flat for the year while the Dow is up nearly 100 bps in 2016 and the NASDAQ and Russell 2000 continue to toil in the red.


In addition to failing to make a higher weekly high, there are a number of conditions present that suggest the market may be opting to digest some of this 6-week rally here in the near-term.  And as we work further into earnings season, money managers are likely to get the evidence they need in determining how to put further capital to work.  We've laid out some of these conditions below:
  • The S&P sold off as it ran into trendline resistance.
  • RSI working off overbought conditions
  • Negative Divergence in Stochastic and Breadth (% of stocks Above 10 and 20 day ma)
  • Our indicators show that buying breadth peaked in early March but since then there has also been a huge lack of selling
  • Financials remain a drag on the market 

  • Europe and Japan remain in downtrends
  • However with the 4% rally in Italy on Friday it shows that global markets are still hostage to government intervention and central bank speak
  • Italy rallied on reports of a bad bank fund being introduced
  • Big up move in the Yen which is a risk off bet
  • The VIX term structure is coming off areas associated with flat to down markets going forward

Happy Masters Sunday!

Sunday, April 3, 2016

March & First Quarter Comments

March featured a continuation of the market strength that began after the mid-February bottom.  For the month, the S&P was up 6.60% while the Russell 2000 surged 7.75% and the NASDAQ gained 6.84%.


Factoring in the first day of April (Friday), the S&P and Dow Jones Industrial Average have now edged into positive territory year-to-date while the NASDAQ and Russell have recovered most of their early 2016 losses.


March's strength is compelling for a lot of reasons, one of them being the environment in which it occurred.  Last month marked the 12th instance since 1950 where the S&P gained 5% or more after hitting a 12-month low in the prior month.  The stats below show that average near-term returns (1 to 3 months) are a mixed bag at best.  Overall, the returns looking a quarter out have been muted on average but there have been some major outliers both up and down.


Looking at some breadth studies, the move off the February lows has created some massive thrusts to the upside on various measures.  One that we track daily is the % of stocks trading above their 40-day moving average.  The indicator has been extremely overbought for weeks now, this is not a typical condition and suggests just how strong this rally has been.

We use Telechart for this data and going back to 1986 the results are surprising.  Using month-end data, there have been 15 prior instances when the indicator closed higher than 80%.  Looking forward 1, 2, 4, 6, and 12 months the results are significantly stronger versus the whole sample size favoring a statistical edge for the bulls. 


We're always in search of what's "working" in a given market environment.  One very general way of doing this is by comparing low volatility stocks vs high beta stocks (SPLV vs SPHB).  When this ratio is trending higher it means low volatility, high quality equity plays are in favor and this is exactly what's happened in recent months.  When you have utilities dramatically outperforming year to date it shows that we're in a market favoring stability over higher risk assets. 


Next, looking overseas at European and Asian markets, all look virtually the same as they remain in strong downtrends.  Further, the moves in most of these over the past 2-months look more characteristic of bear market rallies rather than new sustainable uptrends.  In fact, many are now rallying into overhead resistance areas.  Something to watch out for in the near-term.


Have a great week ahead!