Thursday, May 7, 2015

Nasdaq - Post Winning Streak Update #3 (50 Days Later)

As promised, we've kept a close eye on the Nasdaq's performance since it completed a rather significant winning streak in late February.  If you recall, the index posted a run of 10 consecutive up days with the last day coming on February 24th.  Since then, we've written updates at Day 15, Day 30 and wanted to circle back one last time after Day 50 (yesterday) to see where we stood.

As mentioned in the original post, since 2009, this was the Nasdaq's 9th instance of an 8 day or longer winning streak.  The index's short and intermediate-term performance after those streaks suggested that we were likely to see some immediate weakness (5, 10, 20 days out) followed by very mild gains further out (50 days).  Much weaker performance than if you just bought the index on any given day during this 6 year bull.


As we study the results of this most recent streak, we see a bit more dispersion but the general theme has remained: weak to flat action over the next several days and weeks.

-Day 5 (March 3rd) - Nasdaq closed at 4,979.9 for a gain of 0.237%


-Day 10 (March 10th) - Nasdaq closed at 4,859.79 for a loss of -2.181%

-Day 20 (March 24th) - Nasdaq closed at 4,994.73 for a gain of 0.53%


-Day 30 (April 8th) - Nasdaq closed at 4,950.82 for a loss of -0.35%

Looking at yesterday's close, things have deviated just a bit from historical precedent.  The index closed May 6th at 4,919.64.  This is nearly a 1% loss from the February 24th close of 4,968.12.  So instead of the anticipated small gain after 50 days the Nasdaq has actually fallen 100 basis points.


While the Nasdaq's lack of returns over these time periods can't be attributed to the predictive powers to this or any other study, it's interesting to know that after the index goes on such runs of momentum it's common for it to take a breather for a few weeks/months.  And that's indeed what it's done here.

Tuesday, May 5, 2015

Let's Talk About Sell in May and Go Away...

The first couple days of May have definitely been an extension of the months long choppiness that has come to personify the market.  This from Jeff Saut's (Raymond James) weekly investment strategy note yesterday:


...I have seen a lot of folks attempting to trade this market over the past few months all to no avail. What has typically happened is that one day they are able to make some money, but the next day they give that profit back. Dougie (Kass) even tweeted on this by noting, “The market has no memory day to day!” I have not gone back and counted, but my sense is that over 50% of this year’s sessions have seen 100 point daily swings in the D-J Industrials (INDU/18024.06) with one day being up and the next day being down. If you can trade that successfully, you are a better trader than I am, which is why I have not attempted to trade this market all year. Clearly, sometimes me sits and thinks, and sometimes me just sits! As my friends at the sagacious Bespoke organization wrote Friday morning: “As of yesterday’s close, the S&P 500 has essentially not changed since the closes on: 4/17, 3/30, 2/12, and 12/24. What’s more, 19 of the 88 trading days since 12/23 have seen a tick that included yesterday’s closing price. US equities are on a treadmill thus far in 2015, with year-to-date gains of 1.3% for the S&P 500 hiding a very persistent sideways move.."
As we sit here in no-man's land waiting for the market to resolve itself, we've been left with plenty of time to run even more studies, scans and scenarios.  One such area that we quickly covered was seasonality and, yes, that included the oft-quoted "Sell in May and Go Away" mantra that pops up around this time every year.  
The idea behind the "rule" being that May kicks off a 6-month seasonal period that has historically been weak for stocks and investors should not expect much in the way of gains.  And if you break the calendar down into two 6-month periods (May-October and November-April), the data does support the idea.
In one study, we started in 1995 looked at the S&P 500's performance in every month for the two periods.  The results in the table below show that the index's average performance in the May-October months (0.16%) has been considerably lower than the November-April period (0.92%).  The May-October months also sport a much lower reward/risk ratio, 1.09 vs 1.81.

We also looked at May through October on an individual month basis.  While the overall picture of this period during the last 20 years has lead to basically flat returns, certain months stand out in terms of strength and weakness.  June, September and particularly August have been the historical losers while May and October have offered the best statistical chance for gains.


We're not going to recommend that anyone invest based on solely on seasonal patterns but you could've had worse strategies over the last two decades that's for sure.


Friday, May 1, 2015

Looking Back At April

The major market indexes finished the week on a bearish note however they were still able to post moderately bullish results for April as 4 out of the 5 gauges referenced below were up for the month.  As we touched on in previous posts, some significant weakness started to show up in small caps in the 2nd half of the month as the Russell 2000 finished down more than 2.5%.


A theme that has continued for months now is the choppiness of the S&P 500.  It remains entrenched in a 2+ month trading range.  The S&P had yet another failed breakout to new highs this week in what has become an all too familiar exercise.  The last few days of the month saw volatility pick up as the S&P finished down 3 out of the last 4 days.  Small caps have broken their 50-day moving average while testing prior breakout levels and micro caps (IWC) also failed a breakout to new highs.


If we breakdown what worked this month from a larger global and asset class standpoint (using the ETF heat map from Finviz), we see the following:
  • China continues to be very strong
  • Emerging markets are asserting themselves as a new leader
  • Gold and oil have rallied hard off previous lows as commodities are looking to find a bottom.
  • Some prior leaders are starting to roll over.  Examples include the dollar, India, Germany, and biotech's. 
  • Rally in interest rates have weighed on real estate market. 


The moves in currencies are something that we continue to watch closely as they're having a cause and effect relationship on asset classes.  The recent rally in the Euro vs. dollar weakness has pushed the Dax (German Index) lower as they are heavily export driven.  Meanwhile oil is moving higher as the dollar has weakened.  On top of currency moves you have yields moving higher which is pushing real estate related stocks lower.  Check out the weakness in ITB, VNQ, XHB, IYR.  These emerging themes are something we track daily as they are the small market ripples that can create waves/trends.  We hope to identify them early and hop on for the ride.

Here's what we were reading this week:

Is there actually a huge amount of cash on the sidelines?

Stock valuations are no help in timing trades

Surveying your trading style

Some history on "May Day"

A young surgeon's parting wisdom on life.  Very powerful words.

How the headlines on GDP growth were wrong


Thursday, April 30, 2015

Tracking The Money Flows

We ended Tuesday's post with a look at the dollar's April weakness and posed the thought that this might spur money to flow back into Large Cap multinationals.  And after surveying the most recent data, it appears this is indeed happening.

On a year to date basis, investors have sold out of U.S. Large Cap stocks en masse.  As of yesterday, more than $40 billion had left the asset class since December 31st (most of that coming out of the SPY ETF).  This made a fair amount of sense as Small and Mid Cap stocks had reasserted themselves in the year's first 3 and a half months and handily outperformed Large Caps.  Part of this should be attributed to mean reversion as Large Caps crushed Mid and Small last year but we see the dollar's moves as the major contributor.

However, over the last week we've seen these sentiments unwind a bit and money flows favoring Large Caps.  According to Convergex, Large Caps have brought in nearly $2 billion while Small Cap funds have lost more than $400 million.  It certainly appears that the dollar's recent decline has prompted investors to reallocate back into the Large Caps as they happen to generate a large chunk of their revenues from international markets.


Mid and Small Caps are still outperforming the S&P 500 on a year to date basis but the senior index definitely gained some relative strength in the 2nd half of the month.  We'll continue to use the dollar's moves as one of our primary inputs when looking for strength by market cap.  Case in point, the dollar has fallen further today and while most markets are down, Small Caps are really feeling it with the IWM down nearly 2%.

Tuesday, April 28, 2015

Where Are The Buyers?

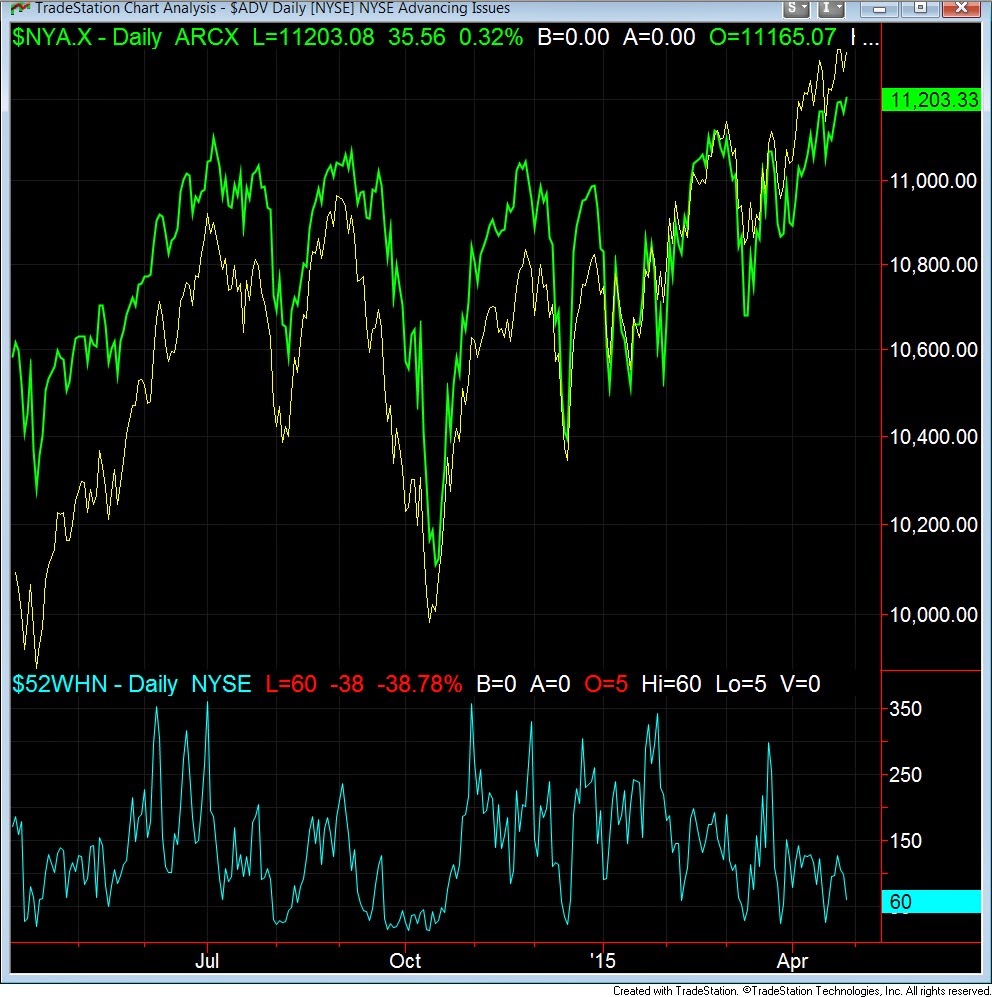
I wanted to quickly touch on breadth from a different perspective today.  Below are the charts of the NYSE Composite and the Nasdaq.  The top panel of each compares the respective index (green) to its Advance/Decline Line (yellow).

There are a couple of observations to highlight.  The first being that the Nasdaq (+6.75%) has dramatically outperformed the NYSE (+3.35%) on a year-to-date basis.  However, the A/D lines for the indices tell a different story.  While Advancing/Declining issues for the NYSE is hitting new highs, the Nasdaq's A/D line has been languishing since last summer.  Further, neither index is seeing much in the way of 52-week highs being set.  The cause of this?  We're not entirely sure particularly in the case of the Nasdaq.  Take a look...


One possibility for the NYSE A/D line's clear breakout to new highs could be that the dollar has started to fall out of its 9 month channel.  Is money starting to rotate back into multinationals?  Something to think about.


Saturday, April 25, 2015

Week in Review (4/20 - 4/24)

This week we continued the slow churn higher with new closing highs for the Nasdaq, S&P 500 and NYSE.  If you look at the long term chart of the Nasdaq you can see how long it has taken to get back to an all time closing high, although we are still slightly short of taking out the all time intraday high from March 2000.  Regardless it's been a remarkable move the last 15 years.


If we look at what moved this week from a sector perspective, technology was the clear leader.  The big moves in AMZN, GOOG, and MSFT on Friday really contributed to the out performance.


One of the themes we touched on earlier in the week was what we'd be looking for in the event that the markets broke out to the upside.  We wanted to see a follow thru in breadth.  So far breadth has not confirmed price highs in the S&P.  There is still time for it to kick in but the markets will need a burst of buying in the next few days to confirm it.  The percentage of stocks above their 10, 20, and 50 day moving averages continues to show a negative divergence.  


Another chart from the site Index Indicators shows more deteriorating breadth.  Below shows the S&P 500 vs the number of stocks at 10 day high minus 10 day lows.  


We continue to operate in a low VIX environment as the volatility gauge closed at a new low for the year. We're seeing lots of complacency among market participants. 


Our favorite reads from the week:

This smart money indicator is flashing incredibly bearish signals

Things people in the finance industry do not want you to know


Albeit a little old by now but still a great interview from Stan Druckenmiller.

We're always interested in understanding how different wealth managers view tactical strategies within their overall portfolios

361 Capital always brings the goods


Thursday, April 23, 2015

YTD Relative Strength - US Large Caps Take A Rest

As the S&P 500 meanders about in this several months long range, it's impossible to ignore the action taking place in certain individual names, sectors, countries and even asset classes.  Many investors and fund managers have been, for years, clamoring for more of a "stock picker's" market and it looks like that environment has arrived, for now at least.

Last year (until the 4th quarter), the S&P 500 and large cap stocks in general marched steadily upward en route to double digit returns.  Meanwhile, most other broadly followed markets struggled to eke out even the smallest of gains.  For example, per Raymond James by way of Perritt Capital, the S&P returned 8.8% more than the Russell 2000 in 2014.  This was the best annual relative return for large-cap vs. small-cap stocks since 1998.  And at the beginning of October, the Russell was actually trailing the S&P by a staggering 16%.  However, over the last 3 months of the year and through the first quarter, small caps have staged a comeback.  They closed the gap in 4Q 2014 and have outperformed large caps by nearly 300 basis points so far this year.

This theme remains fairly constant as you look through a number of other sectors and asset classes and has finally provided investors the opportunity to log gains outside of US Large Cap stocks.  Below is a look at the YTD performance of a variety of sectors/countries/asset classes.  While the S&P takes a much deserved breather, we've seen areas like Biotech, Health Care and Consumer Discretionary take the baton on a sector basis.  Looking globally, China has been on fire, Europe had a very strong first quarter and even Emerging Markets recently joined the party.


And as we write this blog, Bespoke tweets the following:

Another example of the tenor of this market changing ever so slightly.  While gains in Large Caps have been harder to come by this year, there are still plenty of places to make (and yes, lose) money.