Here we are again. Back in the sideways pattern that's lasted since November without a truly decisive breakout in one direction or the other. As it stands, there's not much new commentary to add regarding the current look and feel of the market so this week we're going to assess the most compelling arguments for both the bulls and bears.
In a "give me the bad news first" approach, we're going to dedicate today's post to the Bear case and follow with the Bullish view on Thursday.
Bearish Outlook:
Technicals
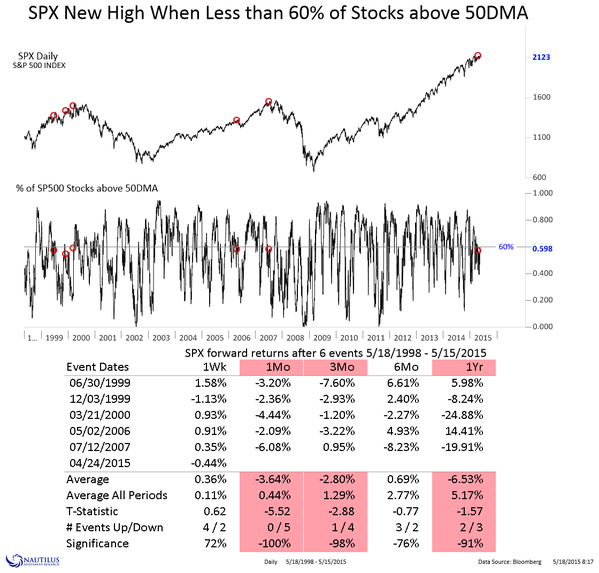
S&P 500 continues to be rejected around the 2120 level. And each subsequent attempt at new highs has brought with it less and less buying pressure. We continue to see the deterioration of breadth across multiple indicators and have talked about this at length over the last several months. One gauge that continues to illustrate this point is the % of stocks above their 50 day moving average. This has steadily declined since November.
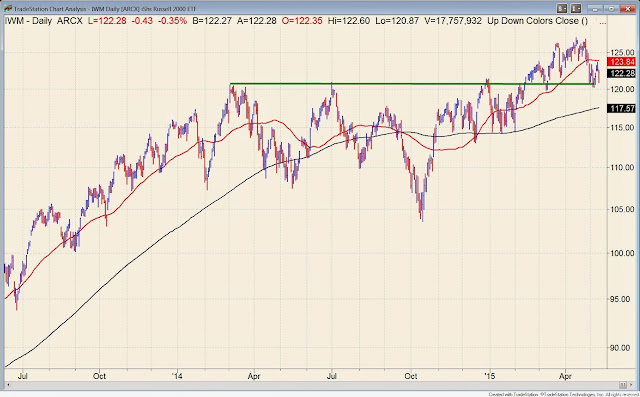
The IWM, which until recently had been a leader, is struggling right now and is again testing prior breakout levels (now support). This would be viewed as a failed breakout if the index continues to lose steam.
Interest rates continue to rise and if we overlay the yield on the 10 year vs the S&P you can see how the stock market has chopped around trying to deal with rising rates from the February lows.
Sentiment
The latest data on margin debt shows that we are again at highs which suggests that speculative optimism must also be. For the bears to really feel confident about this gauge they probably want to see elevated margin debt amounts accompanied by a strong pickup in the rate of change. Doug Short ran a
far more in-depth study of this over on Advisor Perspectives.

And according to Bloomberg, there's not much cash idling on the
sidelines that could be used to push stock indexes higher and out of this
range. They reference Bruce Bittles and William Delwiche,
strategists at Robert W. Baird, who recently noted that mutual fund
managers have the lowest cash levels in history and money market fund levels
are lower now than in 2007 and near a record low from 2000 relative to the
capitalization of the stock market.
Seasonality
As we noted last week, the bearish crowd shouldn't rely too heavily on the "Sell in May and Go Away" theory as basis for an extended down turn. Recent history tells us that, depending on the month, while gains are minimal stocks aren't always downright losers during the lazy days of summer (chart going back to 1995).
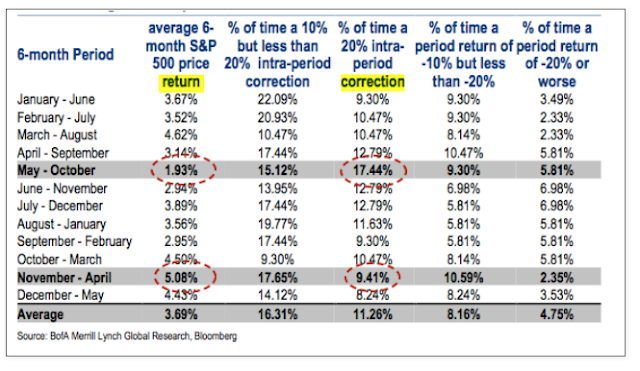
However, May through October is without question the weakest 6-month period on the calendar. Chart below from Bank of America Merrill Lynch.
Valuations
Apparently our own Fed Chair thinks that the market is over valued. Yellen said
"I would highlight that equity-market valuations at this point
generally are quite high, not so high when you compare returns on equity
to returns on safe assets like bonds, which are also very low, but
there are potential dangers there."
And that may be bad news for stocks, says Jeffrey Kleintop, chief investment strategist for Charles Schwab.
"With stocks on the rise in the world’s major markets in 2015, investors
may be overlooking the fact that earnings, one of the most important
drivers of long-term stock market performance, have been falling,"
he writes in Barron's.
"Fortunately, we believe this decline may be relatively short-lived. But
if earnings keep dropping for a prolonged period, stocks may suffer
significant declines, since their above-average valuations in many
markets leave little room for disappointment."
Warren Buffett recently told CNBC’s Becky Quick that "stocks are inexpensive if interest
rates stay low for the next decade, but not so much if interest rates
normalize."
With interest rates rising coupled with extended valuations there is limited margin of safety today, which is most likely another contributor to the choppy nature of this market.
We'll be back on Thursday with a bullish case for stocks.


