For all the hysteria that Monday and Tuesday caused, Wednesday and Thursday swung in the opposite direction as the Dow recorded its largest two-day point gain ever. By Friday's close, the indexes were up modestly for the week as if (on the surface) nothing had ever happened.
However, with Monday being the last day of the month, stocks look poised to finish August with rather significant losses. Each of the major indexes are still down more than 5% for the month and all but the Nasdaq are in negative territory for the year.
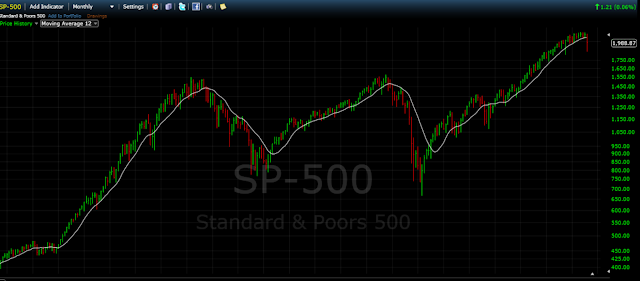
While the indexes did put up a valiant effort this week, there are some concerning developments from a technical perspective. Of greatest concern perhaps is that the monthly chart of the S&P looks as if it will close below its 12-month moving average. This has historically been a decent warning indicator for signaling the potential for more downside ahead. This is something we're going to be watching closely in the months ahead to see how the index responds near and around this moving average.
Also, on the daily chart, you've got the 50-day moving average on the verge crossing below the 200-day. This is something that hasn't happened since 2011.
There were also a number of capitulation signs flashing on Monday and near Tuesday's close. Monday registered as a 90% downside day both in terms of volume and points traded and Tuesday's last hour of trading carried with it some signs of panic selling. By Tuesday's close, we were seeing some seriously oversold measures and felt that a rally (likely short-term in nature) was due.
As we suggested in Tuesday's post, we would be surprised if the market were to put in another V-bottom like it did last October. Historical precedent just doesn't support that type of action. The market is likely to complete this current mini-rally and then undergo some type of retesting action where clear lines of defense are formed by buyers and sellers. Volatility is likely to remain at least slightly elevated through this process until one side overpowers the other. We're not as eager as others to attach a specific headline(s) to market's recent moves but whatever the cause might be (China economy slowing and currency devaluation, Federal Reserve rate timing, oil and commodity volatility, etc), we know that we've entered a new phase of this bull market and we're putting extra emphasis on capital preservation as things work themselves out.
Lastly, as one could probably guess, there haven't been many places to hide on the sector level during the course of the month. Utilities have bucked their recent trend and been an area of strength during the most recent bout of volatility.


