A few of those measures are shown below:
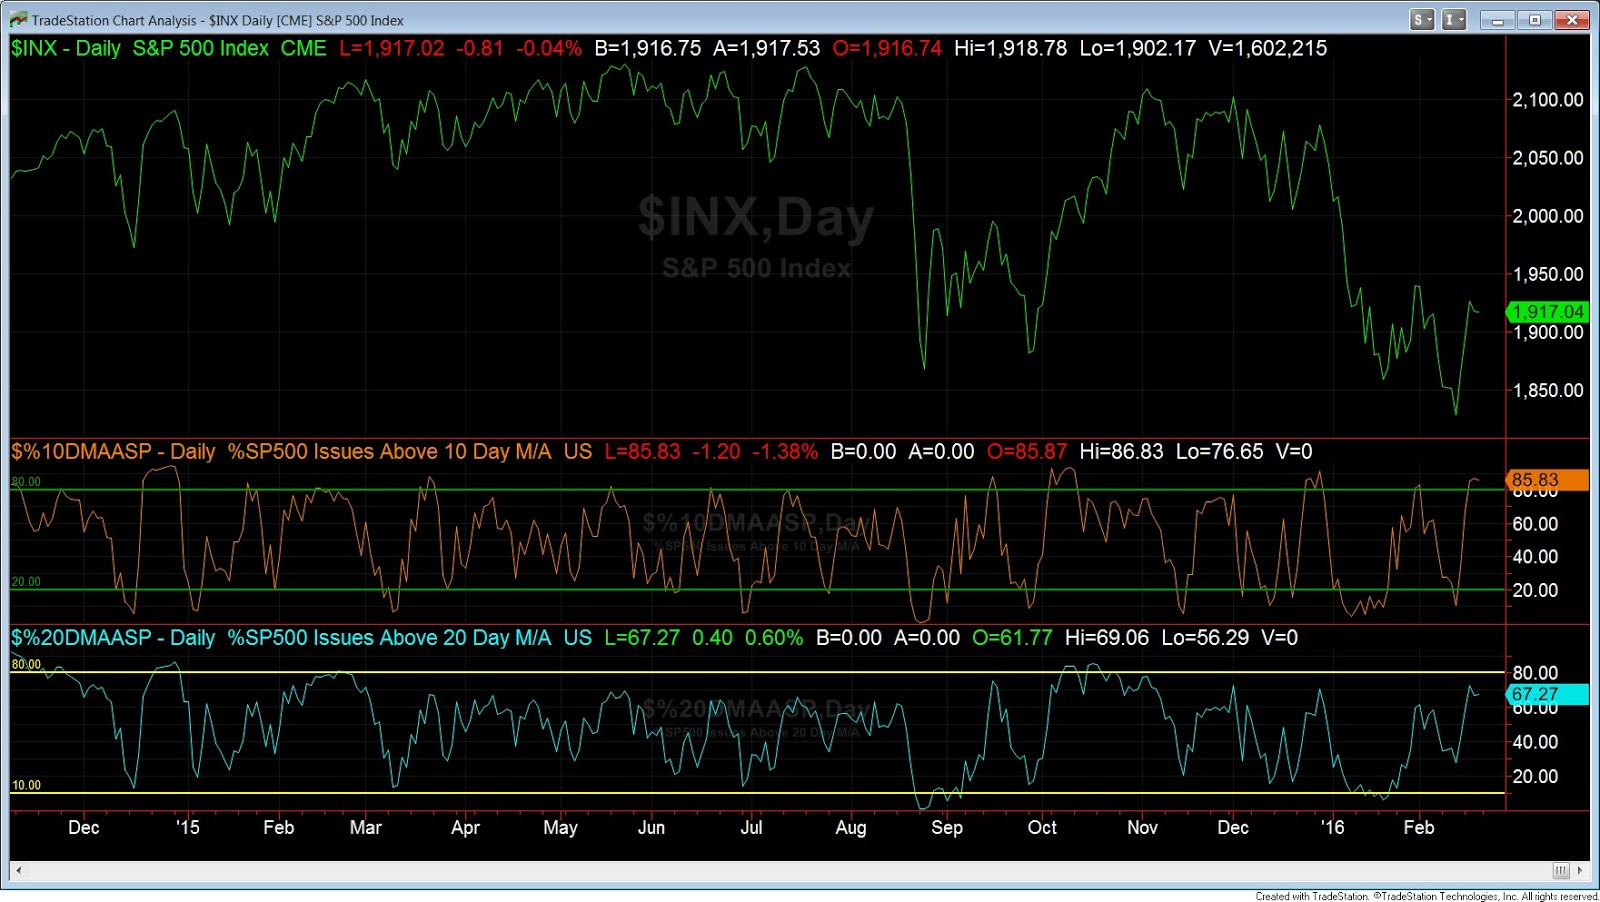
1) The % of stocks above their 10-day moving average is overbought; and the % above their 20-day is getting close
2) 5-day RSI is reaching overbought

3) One way we identify extreme overbought conditions is tracking the # of stocks up 50% in a month. When that number goes above 20 it has generally served as a warning that the market has become overheated. We hit that point on Thursday but what's interesting is how quickly this measure reached an extreme. We ran a study looking at the bigger corrections since 2010, the bounces that followed and how quickly they reached overbought on this breadth measure. The results are shown in the chart below and observations follow.

- Once you get overbought after a bottom the returns going forward (5, 10, 20 and 50 days out) are muted.
- The average number trading days before you get the first overbought signal is 55 days. This last reading took just 4 days!
- 4 days is BY FAR the fewest in this sample and we have no idea what it could mean. One way of looking at it would be that this move is really powerful and the market is setting up for a further push higher. But bears would probably argue that these are the market's last gasps and we're going to really roll over soon.
Taking a longer term perspective, the weekly TLT:SPY ratio chart shows the TLT bumping up against long-term resistance and on the verge of breaking out. If this plays out it would suggest that equity markets are vulnerable to further underperformance.
 Stocks turned in a big week on the back of the Tuesday-Wednesday surge. At Friday's close, the S&P had gained 2.8% over the shortened trading week. Year to date however the market remains firmly in the red with the S&P down 6%, the Nasdaq down 10% and the Russell 2000 off by 11%.   |
|||||||
| We'll see how the short-term overbought readings we mentioned get resolved in the coming days. Hope you had a great weekend. | |||||||