Tuesday, January 31, 2017

What To Expect In February...

With January now in the books and the S&P having advanced 40 points, we looked back at February's past to see what might be in store for stocks in the coming month:

February Stats
  • Going back to 1950 February is the 4th worst month with average gain of just 0.04%
  • However it is also the 4th least volatile month
  • Over the last 20 years it ranks as 5th worst month with average loss of -0.18%
  • Over the last 10 years it ranks middle of the pack as it's the 6th best month with average gain of 0.39%.  However it's also been the 3rd most volatile month
  • Post-Election years lean bearish


Last 20 years average Daily Trend.  No real consistency as the month is choppy.  


Post-Election Years
  • Average return is a loss of -1.84%
  •  9 of 16 February's have been lower
  • Average draw-down from January close is almost twice that of the average draw-up
  • -2.99% average loss in instances where the incumbent party lost
  • Average loss of -2.40% when a Republican has won


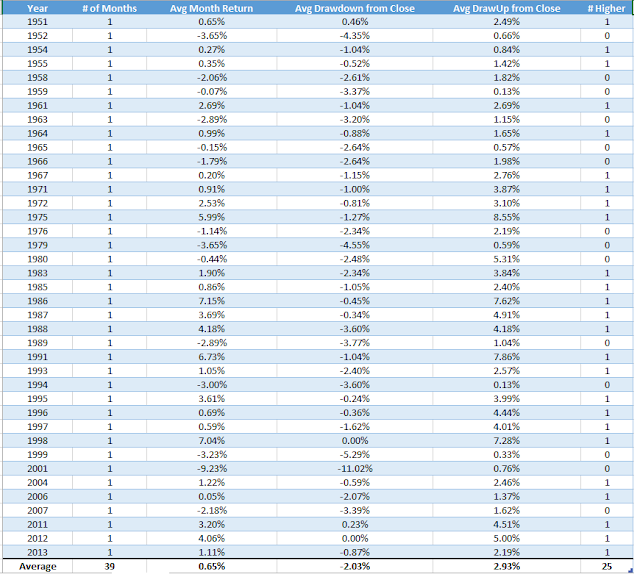
While the stats above lean in the bearish camp all hope is not lost.  If we look at the average February following a positive January the story gets more positive.
  • Average return is a positive 0.65%
  • 64% of February's have been positive when January was positive
  • Average draw-up from the January close is 90bps greater than the average draw-down

Tuesday, January 17, 2017

Dow In Tightest Range Ever: A Case for Short-Term Weakness

Friday's close made it official that the last month has been the most narrow 21-day (a full trading month) range (1.42%) in the history of the Dow Jones Industrial Index .  In other words, things have really stalled out.

With this in mind, we went in search of other narrow periods to see how the index performed over the following weeks.  The results were actually different than what we anticipated.

Returns in the Dow are weaker in the short-term looking out 5, 10, and 20 trading days versus the whole sample.  We do believe in the "trend is your friend" mantra and the path of least resistance remains up.  However, the data below suggests that we could be in for some slight underperformance before we resume higher.

Heading into the inauguration it wouldn't surprise us to see a volatility event as the VIX has been asleep for some time and the kick-off of the Trump presidency might serve as the perfect catalyst.

The big question we have: Is the selling the inauguration too obvious of a play at this point?  Everyone seems to be talking up this strategy.

Below: All instances where the 21-day range of the Dow was less than or equal to 2.25%.  We filtered out clusters. 


Friday, January 6, 2017

Where Do We Stand?

Overview and Technical View:

The S&P has been consolidating since the December 13th high of 2,277 and has hung around the 2,270 level for several weeks now.

After the big surge off the November low (9.3%) and the presidential election the index has decided to take a breather.  This has allowed some excessive overbought readings (rsi, stochastics, mcclellan) to be worked off.  And as the market got extended during the post-election rally, momentum in the form of breadth exhausted itself which caused the slowdown in price movement.

Yet this week we've started to see a resumption of breadth and momentum in a number of readings.   On January 4th the number of stocks up 4% flashed the highest reading since November 11th.  Couple that with multiple 80%+ days on NYSE Advancing Volume Ratio and we see some credibility that the market may be poised for another leg higher.

We're not much for putting price targets on markets but looking at Fibonacci extensions from the two years of congestion that the S&P is emerging gives us a soft target of 2350 at the the 161.8 extension level. 


Index's and Sectors
  • From an index and sector view the technical picture looks positive.  All 10 major S&P sectors reside above their 50-day moving average joining the four major domestic index's.  Globally 6 of 9 major non-US markets are above their respective 50 day moving average.  
  • From a seasonality standpoint January has averaged a loss of -.03% over the last 20 years.  This would put it in 8th place versus all other months.  The average daily trend of the S&P 500 over the last 20 years shows the typical peak coming in the first week of January.
  •  

    Sentiment  and Volatility
    • AAII bullish sentiment at 46.2% was the highest reading since November 23rd.  This marks the 8th consecutive week above 40%.  
    • The CNN Fear and Greed Index stands at 67 flashing a Greed Signal however it is down from an Extreme Green reading of 83 one month ago. 
    • The VIX is at 11.10 and has started the first week of the year down 20%

    Leadership:

    Banks have been the leaders of this market and continue to be on solid footing.  The group as a whole remains extended while digesting gains from November.  A look at GS tells the story.


    Infrastructure plays (steel, chemicals, materials) are right behind banks in leadership.  Some have pulled back and could be setting up for another run higher.


    Yesterday brought some rotation into FANG and growth stocks that have lagged the current leadership but are slowly emerging as a few rallied above their 50 day moving averages on volume the last few days.   NFLX remains the leader in the FANG group as that is testing all-time highs.