February Stats
- Going back to 1950 February is the 4th worst month with average gain of just 0.04%
- However it is also the 4th least volatile month
- Over the last 20 years it ranks as 5th worst month with average loss of -0.18%
- Over the last 10 years it ranks middle of the pack as it's the 6th best month with average gain of 0.39%. However it's also been the 3rd most volatile month
- Post-Election years lean bearish
Last 20 years average Daily Trend. No real consistency as the month is choppy.
Post-Election Years
- Average return is a loss of -1.84%
- 9 of 16 February's have been lower
- Average draw-down from January close is almost twice that of the average draw-up
- -2.99% average loss in instances where the incumbent party lost
- Average loss of -2.40% when a Republican has won
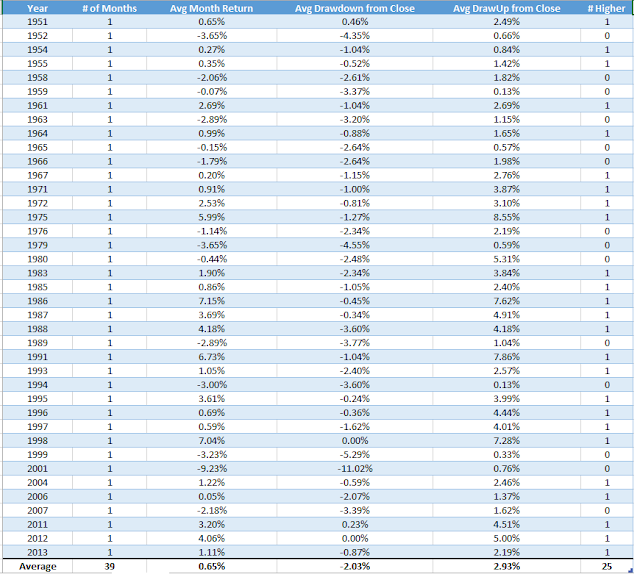
While the stats above lean in the bearish camp all hope is not lost. If we look at the average February following a positive January the story gets more positive.
- Average return is a positive 0.65%
- 64% of February's have been positive when January was positive
- Average draw-up from the January close is 90bps greater than the average draw-down


