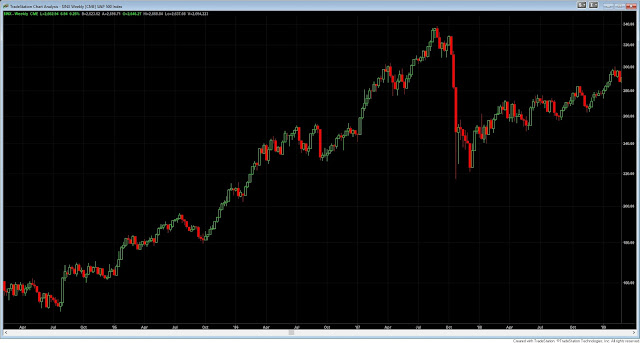
2018
1996-1998
1986-1987
Below if we look at breadth in the form of % of stocks trading above the 50 day moving average we can see that during the current correction, breadth has hit extreme levels associated with prior drops. The good news is when you get a wash out in breadth, historically you are closer to finding a low. Did the market find a low last Friday or are we subject to a retest? Again we don't know the answer to that question. Urban Carmel over at the Fat Pitch Blog tried to answer this question in his latest post. In our own experience, after you get a quick trend reversing move, it typically takes a few weeks for the ultimate low to be established. What we are looking for is the potential for a positive divergence setting up as the market tries to stabilize after the current shock. This will take shape in breadth improving as price probes lows. Our best guess is the general market will need more time to digest the violent pullback we just experienced.
Below are some stats on corrections and bear markets to keep the current move in perspective. According to Goldman Sachs the average bull market correction is 13% over four months an takes just four months to recover versus and average decline of 30% during bear markets.
One of best ways to get a read on the macro environment and sentiment is the monthly fund manager survey from BAML. Below are the key takeaways from the February report.
- Close but no Buy the Dip from FMS: BofAML Feb FMS cash & portfolio de-risking show anxiety, but most FMS metrics indicate “pain trade” remains lower asset prices driven by stronger US$, hawkish central banks, and slowing global growth.
- Bulls not Bears: FMS sentiment nudges BofAML Bull & Bear Indicator down from 8.5 to 8.4, i.e. remains in “sell” territory, suggesting likely test of recent market lows.
- Asset allocators blinked: FMS cash level up to 4.7% from 4.4%, record 20ppt jump in protection-buying and a steep 12ppt drop in equity allocation...note FMS history shows monthly 16ppt drop in allocation required to signal a risk asset rout complete.
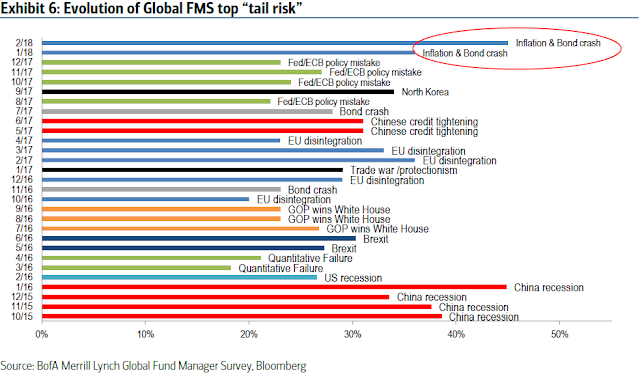
- Bonds crash the party: 60% say Inflation & bonds most likely catalyst for cross-asset crash (#2 was US/EU corporate bonds @15%), bond allocations cut to lowest since 1998, REIT exposure cut to 6-year low; top 3 “crowded trades”...#1 long FAANG/BAT, #2 short US$, #3 short volatility; strong US$ & lower yields would be painful.
- Thinning macro ice: 91% say recession “unlikely” & FMS investors remain long cyclicals (tech, banks, energy, EM, EU, Japan); defensives continue to be shunned despite 70% say “late-cycle” (highest in 10 years); ebbing BofAML FMS Macro Indicator indicates global stock price levels still high.
- BTD, FOMO, TINA dependent on EPS: FMS investors most bullish on profits since 2011, strong EPS most likely positive risk for stocks, and confirm cyclical outperformance to date; interest rate catalyst slowly reversing, leaving EPS as lone driver for risk assets.
- Best contrarian trade: long Utilities, short Banks (68% hit ratio when FMS bank-utilitysentiment this stretched).
In summary, the market got a 5 and 10% correction all in the span of 10 days after breaking records for the longest streak without such pullbacks. Based on our last post the fundamentals remain bullish and the current correction hasn't changed that. We will be watching yields and how they play out over the next few months but with allocations at all time lows to bonds, we think the contrarian position might be the best play in the short term. Our thesis on the continuing bull market remains intact and we think pullbacks should be looked at as opportunities instead of panicking. With that said, from a tactical angle the next few weeks or months could contain bouts of heightened volatility and choppy market action. We plan to keep some powder dry while taking smaller position sizes looking for opportunities to exploit as the market digests the current action and tries to resume the longer term up trend.


