

The statistical analysis sets up very favorably for sizable gains the rest of the year based on the current strength YTD. Below are various studies that validate strength begets strength. As much as we use data and statistical analysis to shape our bias and views we have to remember that the predictive nature of data is just one tool that we use to guide our thesis. Last year was a great example of how useless this data can be and a good reason why we don't follow it blindly.
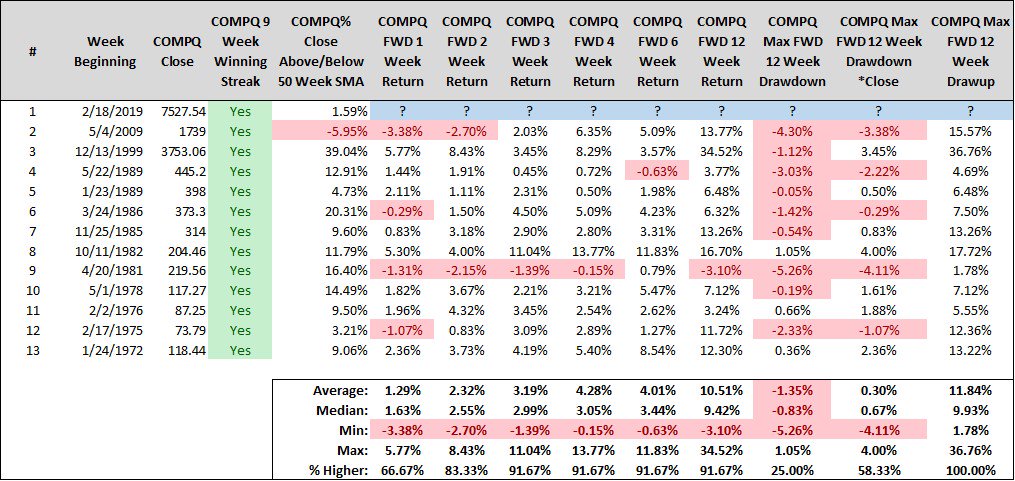
Steve Deppe has a nice table showing what happens after the Nasdaq has gained 9 weeks in a row. If returns 3 months from now meet the historical average (10.5%), Nasdaq will be well above its September all time high.
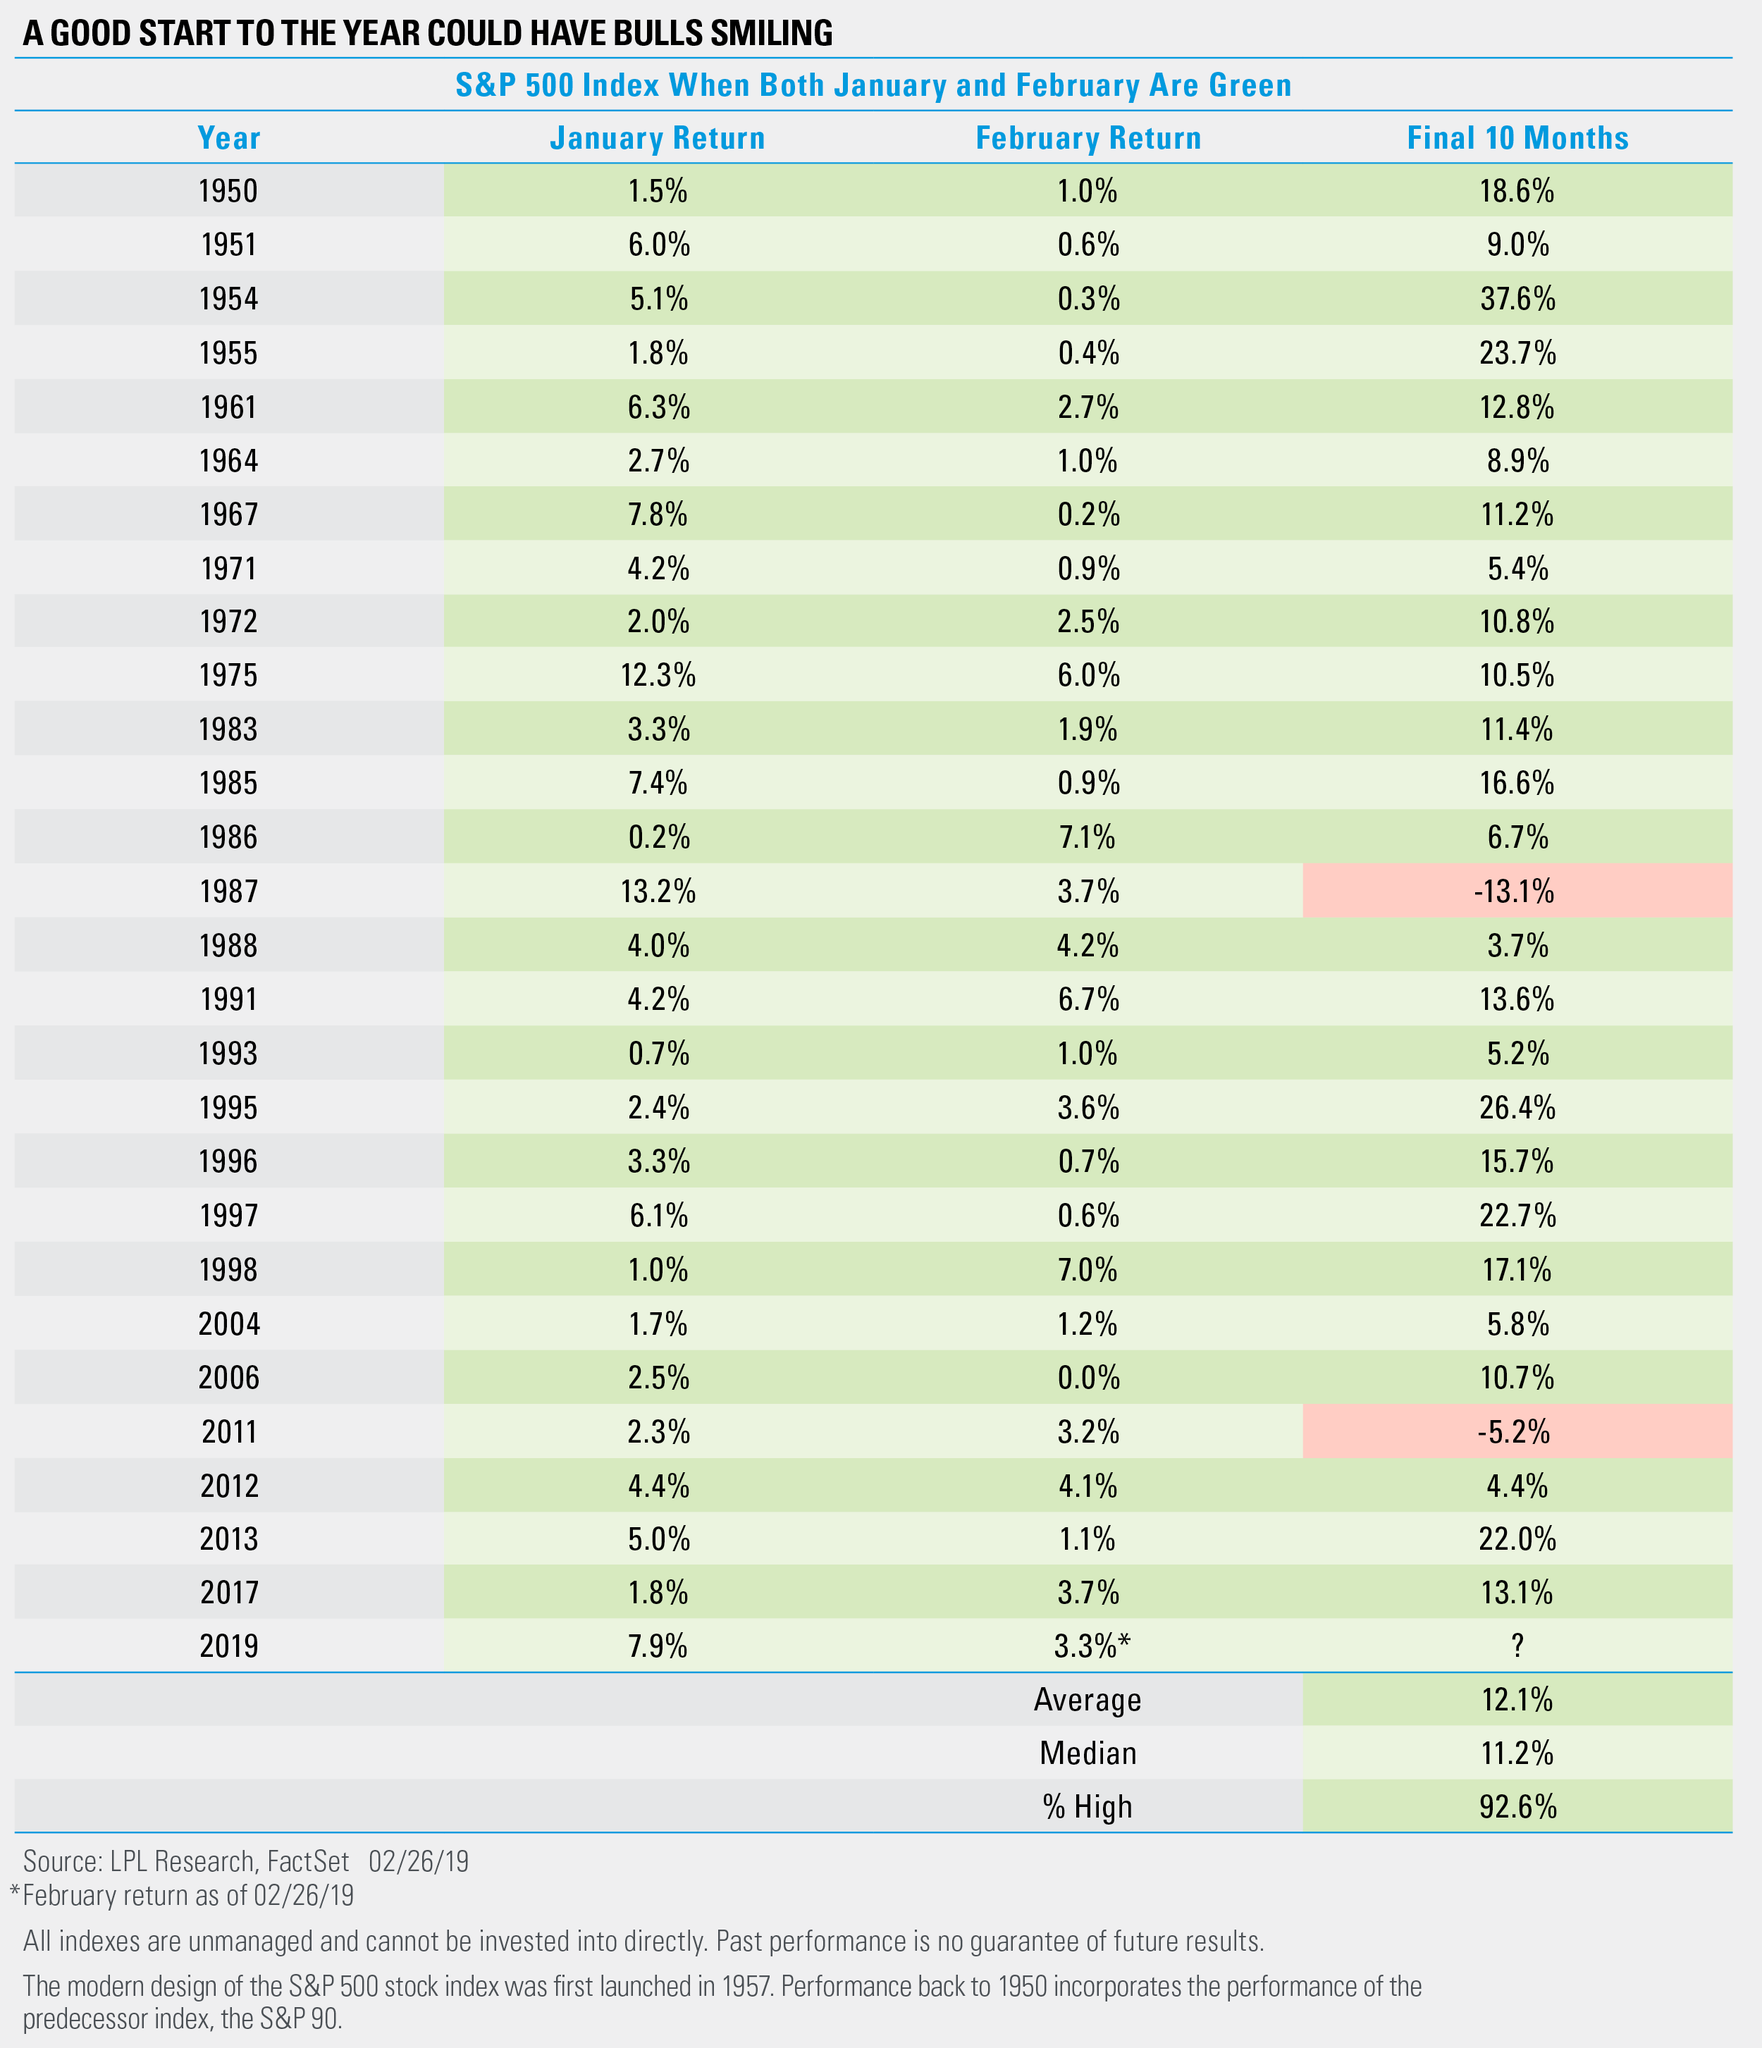
A post from Ryan Detrick shows the past 27 times the S&P 500 was higher in both January and February saw the final 10 months gain 25 times. Additionally, the avg return is 12.1% versus an avg final 10 mos of 7.6.
According to Nautilus Capital when the S&P is up 7.5% or more through February, gains continue to be promising going forward.

An interesting stat from Bespoke speaks to the strength of the winning streak to start the year.
Are you tired of winning yet? Based on the S&P 500's start to 2019, the odds are that if you aren't tired of winning now, you will never be. With the S&P 500 on pace for its 27th up day in the 37 trading days so far this year, 2019 is on a record pace for the frequency of positive days to start a year. Throughout the history of the S&P, there has never been a year that saw so many positive days in the first 37 days of trading (73%), and there have only been seven other years where the percentage of positive days even topped two-thirds at this point in the year. For reference, in an 'average' year it typically takes until March 16th before the S&P 500 has its 27th positive close of the year,and the longest it ever took for the S&P to reach its 27th positive close of the year was in 1932 when the 27th up day wasn't until April 21st.
 The morning track from Raymond James chief strategist Jeff Saut had some good commentary from Leoy Tuey. "Word of wisdom from Leon Tuey as many brokers continue to look for a test of the low. While short-term overbought, a pause is all the bears can expect, but no major setback because:
1. In December, investors panicked and sold down to "sleep level" and beyond. Consequently, they are grossly under-invested inequities and are sitting on record cash.
2. While short-term optimism has risen, sentiment backdrop remains one of fear, not pessimism, but fear.
3. More importantly is global easing. Because of global slowing, the EU, Japan, and the U.S. are becoming more dovish. As mentioned in my reports, last year, Jerome Powell, the Fed Chairman, made a profound announcement that few paid attention: "We would like to smooth out the wild swings in past economic cycles by fine-tuning the monetary policy." If successful, the US and the world will see a period of unparalleled prosperity as history shows that the best environment for equities is in a period of modest growth and stable inflation, not too hot, not too cold, the so-called Goldilocks economy.
4. The record highs set by the Advance-Decline Lines speaks to the strength and power of this bull market. Will they test the lows, not bloody likely!"
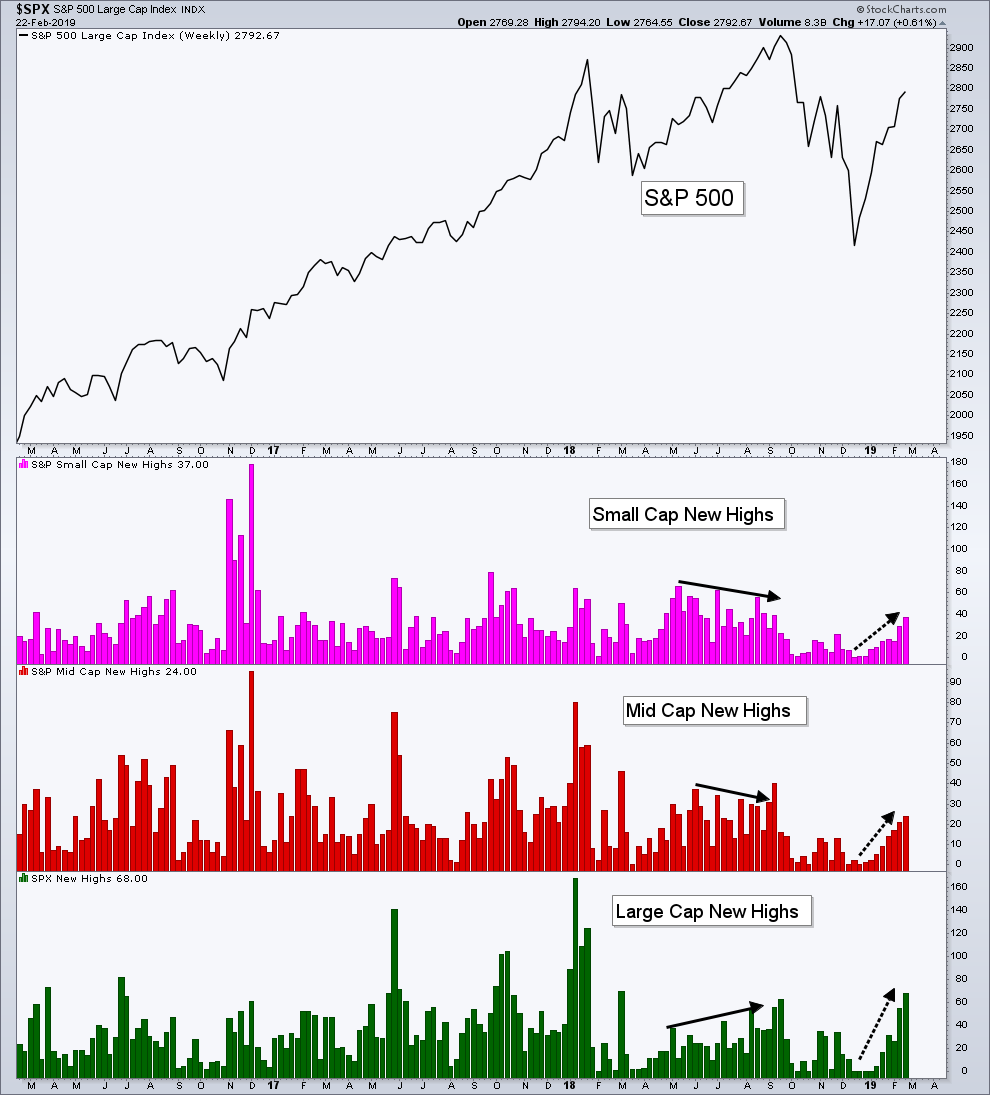
Breadth has confirmed and added to the bullish theme to start the year. An expansion of new 52-week highs along with the % of stocks trading above their 50 and 200 day moving averages continues to increase.
Andrew Thrasher, CMT @AndrewThrasher
The % of stocks trading about their 50 day moving average is higher then the Jan and Sept 2018 peaks.

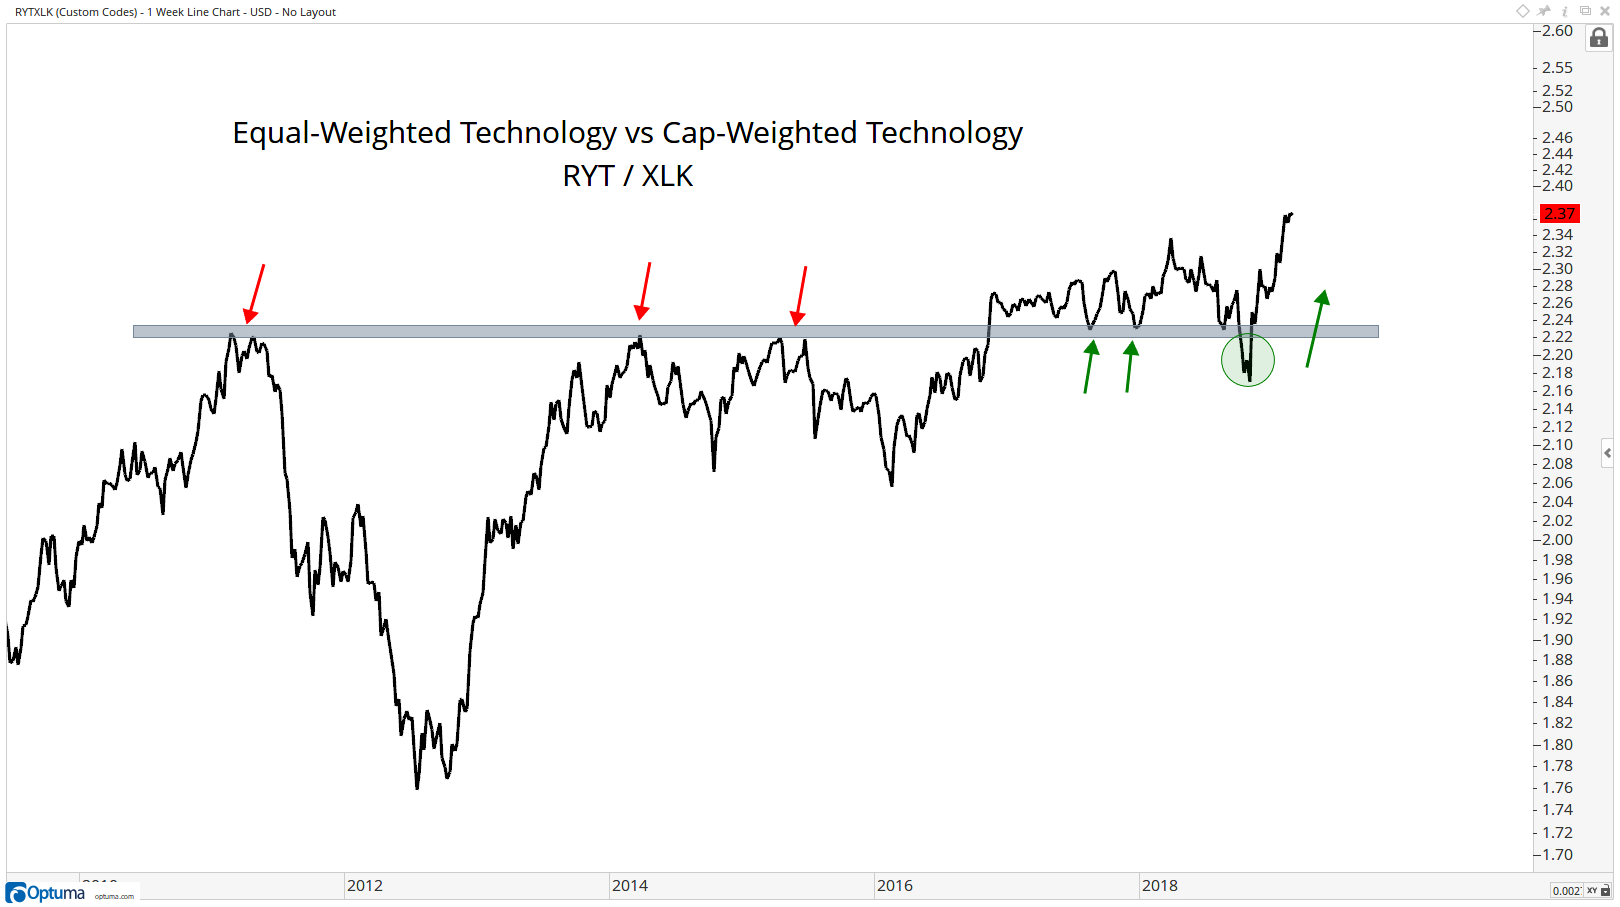
The S&P on an equal-weight basis has led the move higher and taken out the November and December highs before the cap-weighted index. This suggest broad participation and expansion of breadth. Meanwhile the equal-weighted tech index is outperforming the cap-weighted tech index. The FAANG stocks have been a headwind for the cap weighted indices. If they start to rally this move could really get into overdrive.

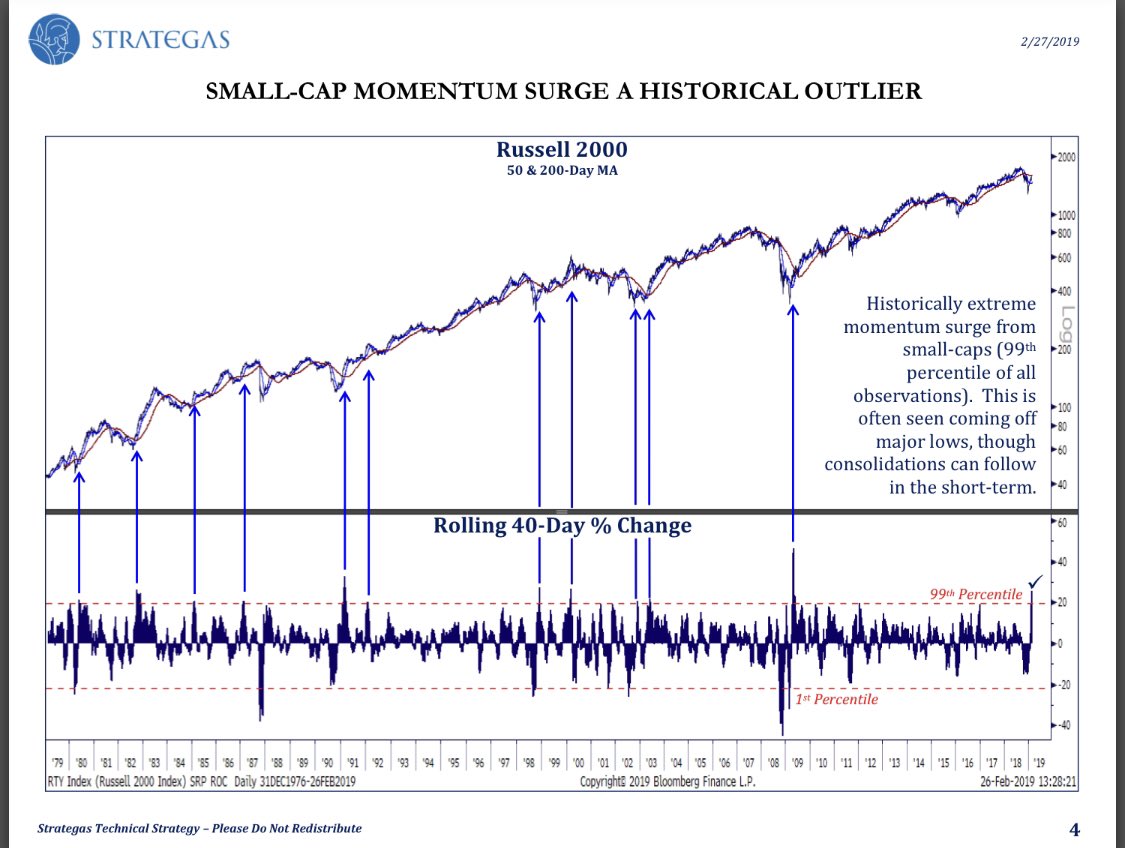
The rally to start 2019 has been nothing short of spectacular. We remain oversold throughout the rally and their is some evidence that the indices could retrace some of the gains in the short term. There is typically a period of consolidation after strong rallies.
40 day % change for small-caps in 99th percentile! Historically rare - data says pause in near term, but better than average returns +6 months forward.@StrategasRP @DanCliftonStrat
2. While short-term optimism has risen, sentiment backdrop remains one of fear, not pessimism, but fear.
3. More importantly is global easing. Because of global slowing, the EU, Japan, and the U.S. are becoming more dovish. As mentioned in my reports, last year, Jerome Powell, the Fed Chairman, made a profound announcement that few paid attention: "We would like to smooth out the wild swings in past economic cycles by fine-tuning the monetary policy." If successful, the US and the world will see a period of unparalleled prosperity as history shows that the best environment for equities is in a period of modest growth and stable inflation, not too hot, not too cold, the so-called Goldilocks economy.
4. The record highs set by the Advance-Decline Lines speaks to the strength and power of this bull market. Will they test the lows, not bloody likely!"
Breadth has confirmed and added to the bullish theme to start the year. An expansion of new 52-week highs along with the % of stocks trading above their 50 and 200 day moving averages continues to increase.
Andrew Thrasher, CMT @AndrewThrasher
While I remain concerned about the volatility landscape, it is encouraging to see new 52-week highs continue to increase across small-, mid-, & large-caps - a luxury we didn't enjoy going into the September high.
The % of stocks trading about their 50 day moving average is higher then the Jan and Sept 2018 peaks.

The S&P on an equal-weight basis has led the move higher and taken out the November and December highs before the cap-weighted index. This suggest broad participation and expansion of breadth. Meanwhile the equal-weighted tech index is outperforming the cap-weighted tech index. The FAANG stocks have been a headwind for the cap weighted indices. If they start to rally this move could really get into overdrive.

The rally to start 2019 has been nothing short of spectacular. We remain oversold throughout the rally and their is some evidence that the indices could retrace some of the gains in the short term. There is typically a period of consolidation after strong rallies.
40 day % change for small-caps in 99th percentile! Historically rare - data says pause in near term, but better than average returns +6 months forward.
Urban Carmel at the fat pitch blog highlights a case from 1989. DJIA rose 9 weeks in a row and then went into a 10% trading range lasting the next 8 months. It eventually broke out of this range and made a new ATH another 8% higher. The lesson: a set up for a longer term continuation higher can sometimes take a frustrating long time to unfold.

We started this blog with a question about how the current strength positions us for the rest of the year. In summary, the data suggests a favorable environment for continued gains throughout the year. Breadth has been expansive, confirming the strong trend higher. However, there is some evidence that a period of retracement or consolidation is a decent probability in the short term.