Tuesday, December 18, 2018

Herd Mentality

We enjoy reading the monthly BAML global fund manager survey to get a better idea of current sentiment and bias in the world markets.  However, we wanted to revisit last years survey to see how traders were positioned going into 2018.  Below is a recap of December 2017 survey.
  • Golditrumps: consensus still smitten by Goldilocks...54% expect “high growth, low inflation” in 2018. Almost 2/3 investors believe US tax reform will induce higher stocks& rates, but fiscal stimulus has coincided with lower, not higher profit expectations, and that will need to change given EPS leads relative performance of cyclicals by 3 month(Exhibit 10).
  • Pro-cyclical Consensus: Investors are long macro “boom”, short “bust”; long stocks,EU/Japan/EM stocks, financials (2nd largest ever), materials (highest since 2/2012) vs short government bonds, US stocks, healthcare & utilities. Pro-cyclical consensus entrenched by US tax reform across asset classes, bar, intriguingly, leading tech sector where allocations dropped to lowest since June 2014 (Exhibit 4).
  • FMS Crowded Trades: ...#1 long Bitcoin (32%), #2 long FAANG+BAT (29%), #3 short volatility (14%), while expectations for a “flatter yield curve” surged (highest in 18months), all trades vulnerable to higher inflation & aggressive ECB/BoJ Quantitative Tightening in 2018.
It's amazing how wrong the herd was with the two most crowded trades experiencing bear markets in 2018.  Both Bitcoin and FANG have gotten crushed this year.  Most were bullish and positioned their portfolios for continued upside in 2018.  Lets use this in context when looking at the most recent survey.  Below is a recap of the December survey. 
  • Dec FMS close to "extreme bearishness"; dovish Fed this week = bear market bounce; but Big Low in '19 awaits end of recession and credit concerns.
  • One year ago FMS investors bullish, long Bitcoin (it hit $19,611 on Dec 19th 2017), global stocks, banks, and short bonds and defensivesone year later FMS investors bearish, long cash, US dollar, defensives, short global stocks, tech, industrials.
  • Dec'18 FMS "bearish"global GDP/EPS expectations down big, stocks allocations at two-year lowsbut cash level at 4.8% not enough to trigger contrarian "buy signal" for risk assets from BofAML Bull & Bear Indicator…now 2.5.
  • New FMS Trading Rules (link) still bearish…US HY Rule = short credit (implies HY spread of 825bps); FMS Treasury Rule = long 10y UST (implies 2.7%); FMS Equity/Bond Rule = long bonds (implies bonds outperform equities by 690bps).
  • Dec '18 FMS shows investors want corporates to improve balance sheets rather than increase capex, return cash to shareholders = first time since '08/'09.
  • Bullish Fed this week: a. 25bps hike plus message of "no inflation" allows pause in hikes and balance sheet tightening, b. US dollar falls, c. positive RTY, BKX, XHB reaction.
  • Bearish Fed this week: a. no hike which triggers recession concern; b. US dollar rally continues; c. sell-off in rate-sensitives and cyclicals (watch RTY) prompts US stocks to join global bear market with SPX flush to 2400.
  • #1 FMS crowded trade = "long USD" (overtakes "long FAANG+BAT"); only reason bullish US$ + bearish risk consensus + Fed capitulation ≠ stocks and credit trading rally is…recession or credit event imminent.
Clearly the tone has changed heading into 2019.  There is a decisively bearish attitude and the survey compliments this.  The December survey shows the biggest ever one month rotation into bonds with large moves into defensive names.

7a3a0dd5ce8047d1a0c07fcc1d0ef2c1.svg

Allocation to bonds rips 23ppt to net 35% underweight, the highest bond allocation since the Brexit vote in Jun'16. 

26c713f0204f422680c74db0cf313701.svg

53% of the FMS investors expect the global growth to weaken over the next 12 months, the worst outlook on the global economy since Oct'08


6f7b8ec1073b4cf48e678ecdf19c0825.svg
FMS investor concern about corporate leverage (highest since Oct'09) tracks equities vs. bond performance closely and implies considerable downside for equities relative to bonds in the coming quarter.

51b23d1b933441e0b09b999e7dc35338.svg


Allocation to equities crashes 15pt to net 16% overweight, a 2-year low.  Current allocation is 0.6 below its long-term average. 

8a20b52cc9f347ee806ab22640c1dd79.svg
However, just 9% of FMS investors expect a global economic recession in 2019, down from 11% last month. 

0724479a3c48491d80cc6d9a6e311750.svg


All this negativity lines up with plenty of indicators flashing oversold conditions.  One breadth indicator we follow is the number of monthly lows.  Yesterday hit levels that are associated with short term bottoms.  Below we can see when these levels spike the S&P has been close to a short term low and attempted to bounce.


The markets are currently experiencing a correction.  This correction has been more severe than the past few corrections but for now remains within the parameters of a normal correction.  The question many people ask is will it lead to an outright bear market.  I wish I knew the answer.  Since I can't predict the market, risk management becomes paramount during corrections.  If this correction turns into a bear market, oversold conditions will remain oversold.  However, the market will still endure violent rallies.  When breadth and sentiment gets stretched to the downside, these are areas to exploit for counter trend moves. 

In summary, the majority has turned bearish according to the recent FMS survey.  They were the exact opposite this time last year.  Will the herd be proven wrong yet again and will 2019 bring in equity strength?  If a recession is avoided in 2019 as most predict, this correction will most likely be seen as a great buying opportunity.  However, if something worse is lurking around the corning we could be in for more pain.  Only time will tell. 

Wednesday, November 28, 2018

Bear market or pullback?

In our last post we posed the question, are we entering a bear market?  Our conclusion, this was a correction rather than the beginning of a bear market.  Since then the facts have changed as the market is constantly discounting new information.  Has this altered our outlook?  Lets get to the data and weigh the evidence. 
 
We always like to start from a top down perspective and look at longer term charts first then drill down to shorter term time frames.  Since the 2009 market bottom, the S&P has remained in a healthy uptrend confined by a very clear channel.  The current correction has taken the S&P to the bottom of the channel and a logical spot to find support.  However, the weekly chart shows that we have broken the lower channel support since the 2016 lows.  The daily chart looks the worst as the 50 day moving average is decisively heading lower with a flattening 200 day moving average.  For now, the retest of the October lows has held as the short term trend remains down.

S&P Monthly
S&P Weekly
 S&P Daily


So far from peak to current lows the major indices have corrected between 10-17%

S&P 500          -11.46%
Dow                 -10.50%
Nasdaq             -16.02%
Russell 2000    -16.55%

Yet, if we drill down to sectors it gets much uglier.  Energy, tech, consumer discretionary, industrials, materials, communication services, and financials have all dropped more than the S&P 500.  The two best sectors since the October highs (utilities and staples) are extremely defensive in nature.

Taking it a step further lets look at some of the biggest tech bellwethers and stocks that have driven upside market returns the last handful of years.  These leaders have received a major smack-down from their 52 week highs.

AMZN        -30.73%  
NFLX         -40.93%
FB               -41.98%

GOOGL      -22.39%
AAPL         -27.07%
NVDA        -54.46%

The pundits can argue about what constitutes a bear market.  While the major indices have avoided the bear market threshold so far, we can certainly make a case that a bear resides in specific sectors.  There has been a washout in prior leadership.  What we do know about bear markets is that since 1950, there have been 35 "corrections", where the S&P has fallen at least 10%. Just 10 of these have gone on to become a bear market (defined as a fall of 20%, in red text in the table below; see note at bottom of this post; table from Yardeni, here).
 

A few indicators we watch to look for a potential bottom is sentiment and breadth.  Sentiment remains fearful exhibited by the CNN fear and greed index.  Consensus has turned noticeably bearish in recent weeks as the AAII sentiment survey shows a bearish reading of 47.1% which is the highest reading since February 2016.


Breadth is also creating a positive divergence as the S&P tested the October lows.  We can see the % of stocks trading above their 20 and 50 day moving averages bottomed in October and is now making higher lows.  Couple that with a dry up in new 52 week lows is a positive sign for now.


The old adage is fitting for the current market as bull markets take the stairs up and the elevator down.  This market correction feels worse in real time but in reality this is normal in an ongoing secular bull market.  On average, the market falls 14% intra-year from peak to trough.  This is the second drop of greater than 10% for the indices this year, making diagnosing 2018 so difficult.  However, if the October lows hold, the foundation is set for a potential bottom in place and a rally to resume.  Seasonality, breadth, and sentiment favors the bulls but price action remains on shaky ground.  As we enter the final month of a very volatile year there isn't a shortage of themes and landmines.  Will the January effect hold, another Fed meeting, trade talks, debt ceiling, etc.  We tend to lean towards the bullish thesis, yet, managing risk is our number one priority and if the market breaks down through the current lows we expect a larger drop which could be the makings of a bear market, at which point we'll reassess the facts.   


Tuesday, October 16, 2018

Are we entering a bear market?

Historically the month of October is known for its volatility and so far it has not disappointed.  The explosion in volatility the first few weeks have coincided with a market correction.  A lot has happened in the last two weeks so lets get to the data.

The old saying, markets take the stairs up and elevator down certainly applies to the current pullback.  Months of gains have been evaporated in days as the speed of the downside move was violent.  However, so far the correction has been contained as the four big equity indices have losses ranging from 7 to 12%. 

Russell 2000   -12.4%
S&P                -7.8%
Nasdaq           -10.5%
Dow               -7.6%


If we take a longer term approach the S&P has declined to the up trend-line channel support from the 2016 lows and the 200 day moving average.   In the meantime, volatility has risen dramatically and we are hitting oversold levels that are consistent with prior bottoms.  Typically the index will take a few weeks or months to find a true bottom.  Many times it will retest the first reaction low after a failed attempted rally which would bring last Thursday's low into play.  Assuming the markets remain in a bull trend, it is highly likely that the markets are closer to establishing a low and turning higher.  Of course, our assumptions could be wrong and instead this could be the beginning of a bigger downturn.  Over the next few weeks we will be looking for some evidence that the selling is exhausted so the markets can move higher.  Until then, patience and caution is warranted.


Breadth has been lagging for months and price finally broke down from the negative divergence.  However, we are seeing a massive flush in breadth as the percentage of stocks trading above their 50-day moving average is at levels typically associated with a market bounce.  


Sentiment has reversed and become washed out creating a contrary buy signal.  According to the October BAML fund manager survey, allocation to US equities reverses much of the climb in Aug/Sept falling 17 ppt to 4% overweight.  The US is no longer the most favored equity region globally.  FMS investors are the most bearish on global growth since 2008 as cash has become a crowded position.  On top of that the current CNN fear and greed indicator is flashing extreme fear.


The quantitative data sets up favorably for the remaining year and even into next year.
Below are some quantitative studies, courtesy of Nautilus research, that show how current momentum justifies future upside. 
  • A new multi-year high for the Dow for the first time in six months is a powerful trend following signal. 6-month gains average +6% (30 up vs. 7 down) going back to 1900. 
  • When the SPX and the DOW both make multi-year highs on the same day for the first time in six months, gains for the SPX average +11% one year out and +20% two years out. The Dow Industrials tend to perform similarly. 
  • Further, please note that when the DOW Industrial Index is up between 5% and 10% through 9/20, returns for the rest of the year average +7.53% (9 up vs 1 down), while the SPX gains an additional +6% through year end (9 up vs 0 down). 
  •  Since 1927, when the SP500 is up more than 8% through Septemberrest of year gains have averaged +4.02%. (31 up vs. 7 down).  
  • Since 1927, when Q3 returns for the SPX exceed 7%6-month returns average +9.31% (17 up vs. 5 down) while 3-month returns average 4.53% (18 up vs 4 down)
  •  The SPX just notched 6 straight consecutive monthly higher closes3-month returns average +3.85%. (23 up vs 4 down).
In summary, while the recent correction has wiped out months of gains, the pain is always worse on the downside.  Volatility has exploded but has created a wash out in breadth and sentiment.  Along with the favorable quantitative data, the recent flush has reset expectations allowing for a potential year end rally.  The odds favor a bottom being creating over the next few weeks rather then this turning into a full blown bear. 

Wednesday, September 5, 2018

September weakness or strength?

As we discussed in our last post, August and September are a seasonally weak period for the markets.  If we look at the data going back to 1950 the worst two months based on monthly returns are August and September.  However, the momentum remains with the bulls and there are plenty of studies that validate persistent strength going forward.


The S&P is up 8.5% year-to-date.  If we look at prior instances when the S&P is up 8% or greater through August we can see that the remainder of the year tends to finish strong.  On average, the S&P returns 4.56% September through year end as strength begets strength.  The remaining years average 2.83%. 


Below is a study from the blog of Steve Deppe:
"Speaking of 5-month winning streaks, if we turn our attention to the bigger picture rather than speculating about the month of September, August landed what has historically been a huge left and right uppercut combination to the bearish thesis.  August saw the S&P 500 finalize a 5-month winning streak that also closed the month at an all-time high. Since 1950 we have 15 prior instance of 5-month winning streaks that closed month number 5 at a new all-time high for the S&P 500.  14 of 15 then saw the S&P 500 close higher 4 and 6 months later, for average returns of 5.43%, 6.35%.  15 of 15 saw the S&P 500 close higher 1 year later, for average returns of 13.69%.  While historically the path of least resistance is always higher for the S&P 500, it's not higher with a 100% win rate.  The directional certainty following 5-month winning streaks has been rather persistent, along the lines of Newton's first law, as the object in motion has tended to stay in motion."


One of our favorite quantitative research firms is Nautilus research.  Below shows the strength in the S&P 500 following the first new high breakout in 6 months. 


Turning our attention to economic numbers the ISM index just registered a 61.3 reading for August.  The key takeaway from the report is that manufacturing demand is strong as the economy continues to grow at a healthy rate.    


All this good news is not without risk and fear.  Certainly there are plenty of issues to worry about in the coming months as always.  The continued trade wars with China headline the uncertainties followed by midterm elections, NAFTA renegotiation's, and the Fed's interest rate policy.  One interesting stat that favors short term weakness is another study from Steve Deppe.  When August makes a new all time high there is a historical tendency for weakness in September.  There have been 13 years with a new ATH in August and the S&P closed September lower in all but two (85%) by a median of 1%.


We started this blog looking at some weak seasonal trends.  A deeper dive turned a bearish outlook into a more positive tone for the remainder of the year.  We continue to favor the long side of this market and the studies above confirm our bias.  The momentum generated through the first 2/3rds of the year should propel the indices through year end.  After 5 straight up months we wouldn't be shocked to see some level of consolidation in the short term but the overall outlook remains favorable. 

Wednesday, August 1, 2018

August and Seaonality

As the S&P 500 embarks on a four month winning streak we wanted to look at how seasonality plays out the rest of the summer.  So far the market has enjoyed a nice summer rally with a healthy gain in July.  However, if we turn to August we can see the potential for some summer angst.

 Looking at August data:
  • Last 20 years: August ranks dead last in monthly performance with an average loss of 1.02%
  • Last 20 years: August has the highest average draw-down from the prior months close while the second lowest draw-up from prior months close
  • Last 20 years: The average daily trend starts weak and finishes at the lows
  • Last 20 years: August is the third most volatile month
  • Since 1950: August ranks second to last in monthly performance with an average loss of 0.09%


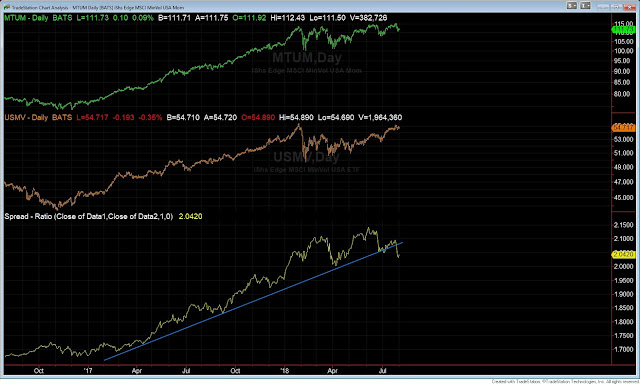
The momentum trade started to breakdown the last few days of July.  Lets look at some ratio charts to possibly confirm rotation into more defensive names.  The first two charts compare momentum to low volatility.  Both are breaking down below their lower trend line support.  The last chart is a ratio of consumer discretionary to staples.  What all three have in common is that lower volatile and more defensive names are outperforming recently.  Does this confirm the trend has changed?  The evidence is not resounding enough just yet to substantiate this rotation.  Yet, this is something we'll closely monitor as we enter August. 


The bull market in equities continues with most indices at new monthly closing highs or very close.  We touched on breadth in our last post and with the recent breakdown in momentum stocks we could be in for some short term pain.  Couple that with the weak seasonality of August and September could set the stage for better entry levels lower before the bull resumes higher. 

Thursday, July 19, 2018

Is current breadth worrisome?

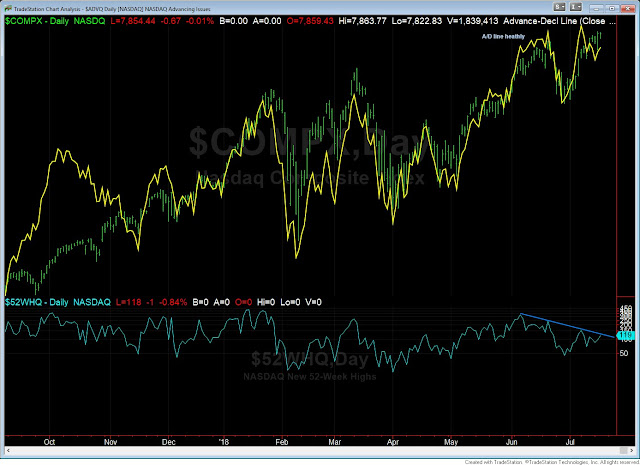
Price action remains bullish as the Nasdaq is at highs and small/mid caps are within spitting distance of new highs.  The S&P is above the 2800 resistance level as the NYSE and Dow remain in consolidations.  It is a good exercise to look under the hood to see what is driving the indices and see if we can gain any insight.  The one thing that worries us is the lack of breadth has not followed price action higher.  The overall Advance/Decline line in the Nasdaq and S&P remains bullish yet some more subtle shorter-term breadth figures paint a different story.  Below are some of the breadth indicators showing negative divergence:
  • Nasdaq new 52 week highs
  • Nasdaq % of stocks above 50 and 200 day moving average
  • S&P new 52 week highs
  • S&P % of stocks above 50 and 200 day moving average


For the indices to maintain new highs or recent strength they will need to have broad participation to follow though to the upside.  With the VIX at complacent levels it won't take much to spook the market especially with thin leadership.  This will be something to watch over the next few weeks as a plethora of earnings are released.  Will participation escort price to new highs or will price succumb to a lack of leadership and retreat?  

Monday, July 2, 2018

Halftime Report

We have reached the half way point for the calendar year and wanted to take the opportunity to review the report card from a performance stance.   We like to start from the top down and then drill into some sector work.  This will gives us a good idea of what is leading and lagging and some of the themes associated that has driven returns.

With that said, lets take a look at a performance map from the first half.  A great resource that does this in a concise manner is finviz.  Below are some observations:
  • US markets are the clear leader versus international developed markets.
  • US small caps outperforming large caps.
  • Emerging markets are lagging with Brazil and China dragging on performance.
  • Fixed income has not been a safe haven to park cash.
  • Commodities are a mixed bag with oil leading the pack higher.
  • US dollar is the strongest developed currency. 
  • Volatility has perked up versus last years doldrums.
  • Retail, biotech, technology, and oil and gas producers are the first half winners.
  • Industrials, consumer staples, and financials are the first half losers. 

It has been a hectic first half of 2018 compared to the quiet trending markets last year.  After a blistering start to the year when the S&P gained 5.6% in January the S&P experienced its first 10% pullback since February 2016.  The S&P dropped 12% and 9% in the first half while the VIX index more than doubled.  However, after all the volatility the S&P produced a modest gain on the year and is clearly outperforming international and emerging markets.  With all the talk of trade wars, it seems the US is winning the war of words strictly on a performance basis.  A simple ratio chart comparing the S&P 500 to the Dow Jones Shanghai index reveals the relative performance of the US vs. China.


One area of weakness that has piqued our interest and something we'll continue to monitor is the action in the Dow and NYSE index.  Both indices have been the worst performers of the 5 major US domestic indices as they both have produced losses for the first half.  Both are sitting on trend-line support that goes back 2 years.  If these levels break it could warrant further downside especially as we enter the heart of the summer doldrums as liquidity dries up and can generate erratic price action. 


When we drill down to sectors there are clearly some surprises that pundits didn't see coming at the beginning of the year.  Most forecasts saw rising rates bullish for banks and financials.  However, instead of a steeping yield curve it has narrowed putting pressure on the banking sector.  The one bright spot has been regional banks within financials.  Tech remains one of the leaders but maybe the biggest shock year-to-date is the emergence of retail as a leadership group.  Most talking heads had brick and mortar left for dead as Amazon takes over the world.  One interesting trend we follow is the ratio chart comparing high beta to low volatility.  High beta stocks have been outperforming since   2016.  However, momentum has been sucked out of high beta names over the last few weeks as this ratio is testing the lower trend-line.  Are we about to see a rotation into more stable lower volatility names?  This is definitely worth watching.


Going further into the micro level if we look at what July has to offer from a historical perspective there is not much to gain.  July ranks right in the middle of the pack for average monthly gains over the last 20 years as it manages to eke out a small profit of 0.37%.  The daily monthly trend shows that gains peak in the middle of month and fade towards the end of the month.  One bit of good news from a contrarian perspective is sentiment remains very low as expectations have drastically come in the last few months.   


The first half of 2018 certainly felt different than the easy trading environment of last year.  As the markets continue to find its footing there are some pitfalls and themes over the next 6 months that could heighten volatility.  These include:
  • Geopolitics
  • November elections
  • Trade and tariffs
  • Italy's political challenges and banking system
  • Fed and rate increases
  • China's devaluation
  • Valuations, debts, and deficits
Following the performance trends give us a glimpse of the winners and losers and where money is flowing.  It also proves that following conventional wisdom isn't always the best strategy.  Looking outside the box can unearth sizable opportunities where the obvious might be wrong.  While the market climbs the proverbial wall of worry, we observe the data and trends to guide our decision making process.  The one theme that dominates is the relative strength of US domestic instruments.  Couple that with the strongest developed economy keeps us in the bullish camp on US equities.  2018 has proven it won't be easy and there remains plenty apprehension, yet we continue to favor buying equities into weakness and riding the current momentum.  

Have a wonderful and safe 4th of July!