Tuesday, September 29, 2015

Beat It, September!

The S&P 500 is down 4.5% in September as we head into tomorrow, the final day of the month.

According to Bespoke, if history is any indicator, the index is unlikely to see any reprieve as we close out the quarter.  Based on data going back to 1945, September 30th comes in as the 5th most negative calendar day for the market over that span.  Stocks have averaged a loss of 0.15% on that individual day over the 70 year period and the index has been negative in 50 of the 70 years.  Further, since this bull market began in 2009, the S&P has been down on September 30th every year (except 2012 when the 30th fell on a Sunday).


As we head into October, the market certainly looks to have its work cut out for it if it hopes to keep this losing streak from extending to 3 straight months.

Among other things, here's a sampling of the headwinds currently working against the bulls:  The VIX is still above 20, we have a potential government shutdown looming on the horizon, the Fed-speak we've been hearing has been more than a bit uneven and there's even talk that they missed their chance to raise rates, commodities are still in the toilet and they're weighing on stocks, we're still seeing the big up and down days in the indexes which indicates elevated fear, October will bring about an increase in mutual fund tax-loss selling, we're smack in the middle of the worst period of the year from a seasonality perspective, the Russell 2000 is now trading under its August lows, we've got one of the world's most visible investors warning of another crash in the making and the list goes on.

Almost makes you think that it's the perfect recipe for the market to be setting up for a big bounce here.  We're not going that far but we'll see...

Saturday, September 26, 2015

Week In Review (9/21 - 9/25)

Stocks limped to the finish line yet again yesterday as the morning rally fizzled out in the afternoon hours and the S&P 500 ultimately closed in the red.  The index has finished down in consecutive weeks now thus ending a span of 11 weeks in a row where it alternated between up and down.  This type of weakness lines up well with what we should have anticipated from a seasonal perspective.  According to Ryan Detrick, we currently sit smack in the middle of what's been the toughest stretch of weeks for the market over the last 10 years.  The chart below shows how all weeks have done over the last 10 years.  This week was week #38.


He says that if we dip a little further back into time, we see that things get a little hairy here for the market.


So while the market attempted to rally on multiple occasions this week, those efforts were rebuffed and the S&P finished down nearly 1.4%.  The Nasdaq and Russell 2000 really lagged behind while the Dow held up fairly well considering the damage elsewhere.


The indexes remain down for September and appear to be on their way toward a 2nd straight losing month.


Nicholas Colas, Chief Market Strategist at Convergex offered up some insight this week on just how hard it's been to find returns so far in 2015.  Presented below without interruption:

Summary: Netflix may be the only S&P 500 name that has doubled in 2015, but it’s not really the most important stock in the index.  First, there is Amazon, up 72% on the year. The online retailer is the single reason the large cap Consumer Discretionary sector is up on the year, for without AMZN’s 9% weighting that group would be down over 3% instead of 3.4% higher. Then there is UnitedHealth, 20% higher on the year, which is enough to make Health Care “Green on the screen” for 2015. Without it, that sector would also be negative in 2015. Why all the fuss?  Because these are the only industry groups in the S&P 500 that are up for the year, but it’s all because of those 2 stocks. Pull back the curtain on the entire set of global capital markets, and the story is similarly dreary. Domestic bonds?  Down 1-5%.  Precious metals?  Down 3-4%. Developed economy equities?  Down 6%.  Emerging economies?  Down 17%.  Fourth quarter 2015, which starts in 4 trading days, will be a lively period as investors work out which of these asset classes will go positive and which will sink further.  In short, for many active investors the year comes down to the next 3 months. 
With less than 100 calendars days – and only 69 trading days – left in 2015 it’s not too early to consider what kind of year we’ve had in capital markets. Simply put, it stinks. That assessment isn’t just because of the -6.1% return for the S&P 500 year to date.  Rather, it is because essentially nothing has been working. Consider:
·U.S. stocks, regardless of market cap range, are down on the year. The S&P 400 Mid Caps are down 4.3%, and the 600 Small Cap Index is down the same amount. The Russell 2000 is 5.3% lower.

·Developed economy equities – we’ll use the MSCI EAFE (Europe, Asia, Far East) index here – are down 6.4% in dollar terms for 2015 YTD. Emerging market equities, as measured by the MSCI Emerging Markets Index, are 17.4% lower in dollar terms.  Even the popular ‘Long Europe, short the euro’ trade is down by 3.4% in 2015. 

· Fixed income assets, typically a hedge against lower equity prices, are lower on the year.  Long dated Treasuries, as measured by the Barclays 20+ Year T Bond Index, are down by 2.6% year-to-date.  Domestic high grade corporate bonds are 2.8% down in 2015, and high yield corporates are 5.7% lower.  International bond indices like the Barclays Global Treasury ex-US index are 5.6% down on the year. 

·Precious metals are down 2.7% for gold and 4.2% for silver. 

·If you want to find appreciating assets, you have to go pretty far afield, or exhibit some unique insight and bravery. For example, old Ferraris, according to the Historic Automobile Group International (HAGI), are up 8% year to date.  Closer to home for equity markets, there are 9 U.S. listed exchange traded funds that are up more than 30% on the year, but all of them are highly volatile and most use daily resetting leverage to achieve those returns.  More generally, only 400 of the 1,773 ETFs listed in the U.S. currently show a positive return.
If you focus on U.S. equities, you might rightly point out that two industry sectors of the S&P 500 are up on the year: Health Care (+0.6%) and Consumer Discretionary (+3.5%).  And that much is true, but lest you think this is a sign of widespread enthusiasm for these groups, consider that in each case it is only one stock that puts these industries in the green for 2015.  The math here:
·Amazon is up 72% year to date and has a 9% weighting in the large cap S&P Consumer Discretionary Sector Index.  That means it has added 6.5 percentage points to the group, almost double its actual performance.  Put another way, without Amazon the Consumer Discretionary sectors would be down 3% in 2015, right in line with the performance of the other consumer group – Staples – which is 3.0% lower for the year.

·In the case of that squeaker positive return for Health Care, it is UnitedHealth that pushes it into the black for 2015. UNH is up 19.8% on the year and has a 4.5% weighting in the S&P large cap Health Care index. That means it has boosted the overall return for the group by 0.9% - again, enough to lift the return to a positive number for the year.

· In short, Amazon and UNH are all that separate the 10 industry sectors in the S&P 500 from showing a negative return not just for the S&P 500, but for every major industry classification. 
If all this makes you think that “Big Winners” have been thin on the ground in 2015, you are correct.  Looking at the top performing stocks thus far within the S&P 500, we find the following:
·Only one stock has managed to double in 2015: Netflix (up 113% as of the close today).

·Only five stocks are up +50%.  There is NFLX, of course, Amazon (+72%), Cablevision (+64%), Activision (+ 58%) and Under Armour (+51%). 

·Only 10 stocks are up +40%. They are the names above, plus Electronic Arts (+46%), Martin Marietta Materials (+45%), Starbucks (+42%), Expedia (+42%) and Vulcan Materials (+41%). 

·Only 29 stocks are up 25% or more. We won’t list this last batch, but you get the idea. Less than 6% of the S&P 500 is up 25% or more. Conversely, 74 names (15% of the index) in the S&P 500 are down 25% or more. 
Now, the year isn’t over, and that’s the most important point of this exercise.  With just 3 months left on the calendar, many investors are down on the year for the reason we’ve outlined here: nothing is really working.  That leaves them only a short period to show a positive return, or at least a less-negative result than whatever index they track. To do that, many will have to make very specific and concentrated bets. It might be about equities generally – will they recover from the current growth scare?  Or it might be asset allocation – will bonds finally go up on the year?  For stock pickers, the key question is certainly “Play the winners, or look for laggards?” 
All we know is that with 69 days left to play catchup, time favors the fleet.  And the bold.

Thursday, September 24, 2015

Stay Relentless

To be an above-average investor, a person must possess a number of traits and skills that simply don't come naturally.  We touched on this thought recently when we highlighted the latest memo from Oaktree Capital Chairman, Howard Marks.  In it, he referred to a comment once made to him by Charlie Munger: "Investing is not supposed to be easy.  Anyone who finds it easy is stupid."

On top of the obvious need for a passable IQ, a superior investor requires certain traits that can only be acquired through repetition and commitment.  While we're not big on rah-rah, no pain-no gain soapbox rants, we're huge believers in process and efficiency and constantly challenge ourselves to get better in those areas.  The market is a constantly evolving being so we must be as well.

That thought brings us to the point of this post which is being and staying relentless.  Nick Woodman, CEO of GoPro, was recently asked about dealing with competitors and how to stay in front of them.  His response? "You have got to be relentless.  One of the things that's really benefitted GoPro is a healthy dose of fear..."

His comments on relentlessness start near the 18:00 mark of the linked video and last only a couple of minutes.  But the message within hits a chord with us.  While we're not competing with any one individual or company, we are jostling with ourselves as well as an entire marketplace of differing wills, ideas and opinions.  Our job as investors is to develop a process/thesis that shows a proven edge for making profits and then performing the proper ongoing maintenance that allows it to evolve along with the market.  This is a task that's easier said than done but those most likely to succeed are the ones who are willing to be relentless in order to combat that persistent fear of losing out to the competition (the market).

Tuesday, September 22, 2015

Circling Back on Backwardation

Our September 1st post, Looking at the VIX, focused on the fact that the VIX futures market moved into backwardation on August 20th and what that could mean for the market over the next couple of months.  As a refresher, backwardation occurs when near-term VIX futures become more expensive than longer-term VIX futures (in this case the 3 month VIX contracts).  It's a fairly uncommon event and suggests that traders are betting that volatility in the future (3 months out) will be lower than it is now.

We then looked at the times where backwardation had occurred since the 2009 bottoming process and found that the 2009-2011 period of instances looked quite different than when the event happened in the 2012-2015 timeframe.  Essentially, from 2012 to early this year, whenever this situation developed it was a pretty reliable indicator to buy the market as V-bottom recoveries became the familiar theme.  However, from 2009-2011, the S&P 500 was not as sure-footed in the days shortly after a period of backwardation and the index's results 5, 10 and 20 days out were a mixed bag.  You can see the charts for each period in the link above.

So we wanted to circle back on this thought and assess how things had unfolded since August 20th.  At the time, we suggested that this market felt a bit more like 2009-2011 than a market eager to put in a V-bottom ala 2012-2015.  So far, this has been the proper assumption with results having been decidedly negative and not at all indicative of a V-bottom.

Here's how the S&P has fared since backwardation happened on August 20th:

5-days: -2.361%

10-days: -4.155%

20-days: -3.814%

However, if we stick with the 2009-2011 analog, the numbers suggest that the market could see a handsome rebound over the next 30 trading days as the average 50-day return for this timeframe was 6%.

Saturday, September 19, 2015

Week In Review (9/14 - 9/18)

Up to and for a short time after the Federal Reserve's meeting on 9/17, the S&P 500 had rallied 3% from last Friday's closing level of 1,961.  However, once Janet Yellen announced that she would not be raising short-term interest rates, the market once again went into flux as it sought to digest the news.  Stocks rallied for about an hour after the 2pm Fed announcement but from there on it was all downside for the S&P.  From roughly 3pm Thursday to Friday's close, the index fell more than 3% to settle barely in the red for the week.

We're still of the mind that stocks will need some time to recover from the recent spike in volatility and the late August correction.  We expect volatility to remain elevated and should see some big moves in either direction.

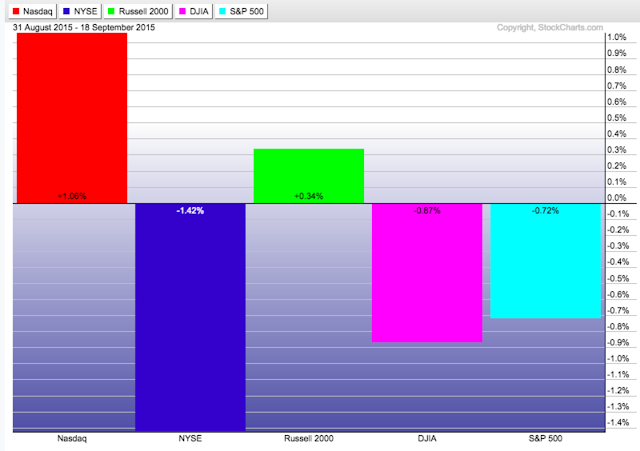
Here's how index performance looks on more extended timeframes:

Month-to-Date:


Quarter-to-Date:


Year-to-Date


Thursday, September 17, 2015

An Oldie But Goodie

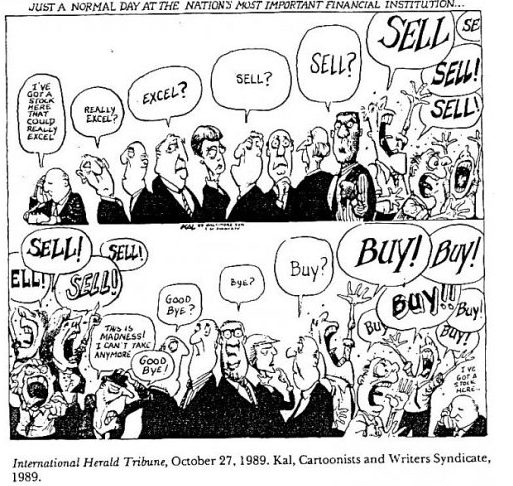
This comic has been used to sum up numerous wild days on Wall St over the years and today felt like an opportune time to dust it off.


After the 2pm Federal Reserve announcement, the market zigged and zagged all over the place only to finish down just 0.25%.  Not much made sense in the last 2 hours of trading and we're likely to see similar days ahead.

Tuesday, September 15, 2015

"It's Not Easy" - Howard Marks

Howard Marks' investing style could not be more contrary to ours in terms of the underlying assets his strategies hold (distressed debt, high yield bonds, etc) however his quarterly letters are absolute must-reads for us because of their themes and lessons.

Marks serves as chairman of Oaktree Capital Management, LP and his newest commentary was published late last week.  It's simply 15 pages of pure knowledge and insight.  In it, he reminisces of conversations with Charlie Munger, touches on the topic of "second level thinking", the role of counterintuitiveness in investing, offers up potential misconceptions within several time-honored pieces of investment wisdom, comments on the recent volatility in the world's markets and introduces a few lessons worth noting and, lastly, a few thoughts on why it's so hard to be a superior investor.

We encourage you to read the letter.  And then maybe read it again.  Oaktree's website also offers a full archive of Howard's past letters that are just loaded with great lessons.

We'll leave off with one of our favorite thoughts from this current commentary:

"Confidence is one of the key emotions, and I attribute a lot of the market’s recent volatility to a swing from too much of it a short while ago to too little more recently. The swing may have resulted from disillusionment: it’s particularly painful when investors recognize that they know far less than they had thought about how the world works. In this case, when China’s growth slowed, its currency depreciated and its market corrected, I think a lot of investors realized they don’t know what the implications of these things are for the economies of the U.S. and the world. It’s important to remain moderate as to confidence, but instead it’s usually the case that confidence – like other emotions – swings radically."


Saturday, September 12, 2015

Week in Review 9/8 - 9/11

First we would like to take a moment to remember all those that lost their lives on 9/11.  We at Worch Capital certainly will never forget.  God bless America.


Friday closed the holiday shortened week on a quiet note that saw volatility and the range dry up as the week wore on.  Friday capped a week in which we made successive higher lows and finished in a bullish tone as all the major indexes finished higher.  That said, we would expect a range expansion and volatility to come back next week. 


A great chart, posted below, by one of our favorite technicians Chris Kimble details the current resistance in the S&P 500.  On the upside the 2000 level is an area of significant resistance with 2040 the next level we'll be watching if the 2000 area is breached.  On the downside 1900 is the closest support area we are watching with the August low of 1867 an important psychological level. 


One chart we wanted to show was the long term daily chart of the S&P 500.  We have a simple 200 day moving average.  In what hasn't happened since early 2012, the slope of the 200 day moving average is now down.  Ryan Detrick once again provides some great stats on this and the weakness that follows.  In the bottom panel it shows the % above or below the 200 day average.  In bear markets this will stay extended to the downside.  In bull markets this can be used as a guide to show downside exhaustion.  The current break lower in the market has shown signs of exhaustion from a momentum standpoint.  However if price is to test lower levels this indicator has room to expand to the downside ala 2011.  We are of the belief that lower levels will be tested.  However we still remain in the context of a secular bull market which will ultimately see higher prices which should contain the downside move. 


From a sector standpoint health care and technology lead the way this week.  On the downside the weak get weaker as energy lagged once again.  Financials remain fickle as they were mostly flat as talk about September's Fed meeting dominates the headlines.


Have a great weekend.

Thursday, September 10, 2015

Looking For An Analog

As we discussed in August 25th's Case of the Mondays post, we still believe there's plenty of data to suggest the next few weeks/months will be quite volatile.  We're of the mind that the late August volatility won't just simply wash away like last October's sharp pullback.  We came across Doug Kass' latest market commentary and found ourselves both impressed and agreeing with some stats generated by Bianco Research:

“Bianco Research has done some excellent work on market volatility that I wanted to share.

Drops of 10%-plus in only four trading days is a rare phenomenon. A 10% drop occurred Aug. 21-25; that’s only the ninth time since the Great Depression. As seen below, these events are typically an outgrowth of major economic or corporate failures.

The other eight periods of 10%-plus drops were seen in August 2011 (U.S. lost its AAA credit rating), October 2008 (financial crisis), July 2002 (Worldcom defaulted), August 1998 (Long Term Capital failed), October 1987 (portfolio insurance causes a stock market crash), May 1962 (President Kennedy introduces steel tariffs), May 1940 (Battle of Britain) and March 1938 (Fed policy error). 
Importantly, according to Bob Farrell, ‘all these  drops were followed by retests or lower lows in the weeks or months later, whether in bear or bull markets.’

Only two of these drawdowns occurred in bull markets– in 1998 and 2011 (Jim "El Capitan” Cramer discussed August 2011 on Mad Money last night). Accordingly, if you think the recent drop is within the context of a bull market sell-off, those two years might be instructive. Bob mentioned to me that 'in 1998, the volatile four-day crash established the low for the reaction in late August which was tested in early October. New highs were reached four months after the low. In 2011, the lows were made in mid-August and were tested three times with a slightly lower final low made in early October. It took five months to rebuild and get back to new highs.’

Bob calls these “best case” scenarios.“

---

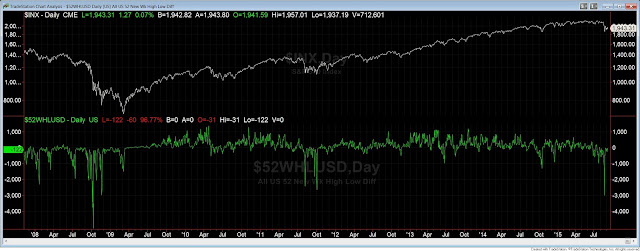
Another important measure for us in observing the market's "health" is staying up-to-date on breadth readings.  In a normal correction, downside breadth will usually exhaust itself and bottom out before price.  It seems as if that could be happening in this instance as late August brought about the highest reading of new 52 week lows on the NYSE since the fall 2011 correction.  Further, the 52 week high-low differential hit its lowest point since the financial crisis.


Lastly, we found these tweets from MarketTells.com yesterday to be something worth watching through tomorrow's close:

While it doesn't offer us any insight on the likely direction of the 3% move, let's hope that with today's 0.5% gain that tomorrow isn't a complete wipeout to the downside.

In the Kass article linked above, he suggests using the fall of 2011 (European Debt Crisis) as a template for how the next few months might unfold.  While that's entirely understandable and he may very well be right, we're inclined to side with comparisons against the weeks/months following the 2010 Flash Crash as we felt that August 24th was very similar to the day of the Flash Crash (May 6th, 2010).  But with the volatile moves in currencies and continued weakness in commodities we can't rule out a bigger crisis similar to 2011. 

Tuesday, September 8, 2015

Some Added Perspective

We've consistently praised the work of Jeff Saut and his investment strategy team over at Raymond James.

We found his market commentary this morning to be remarkably insightful as he combined anecdotes, past history lessons and current market readings to weave a great story.  One of the things we really like about Jeff and his team is that not only are they willing to take a side but also they admit when their calls are proven incorrect.  We find that refreshing in an age when so many "market gurus" will proudly pound their chests when they're on the right side of a trade yet are nowhere to be found when their predictions go bad.

In today's post, Jeff touches on the current market and various reasons for why one could be bullish or bearish while also emphasizing the need for a risk management process to be a part of any investment strategy no matter the goal.

From this morning's note:

"...This is called a stop loss, a predetermined exit point, a protection from the black swan. I find it rarely practiced.” Rarely practiced indeed, as can be seen in most portfolios this year, which is why I have averred, ever since arriving at Raymond James more than 17 years ago, “Don’t let ANYTHING go more than 15% - 20% against you without either selling, or hedging that asset to the downside!” As legendary hedge fund manager Paul Tudor Jones states, “I’m always thinking about losing money as opposed to making money. Don’t focus on making money; focus on protecting what you have.”

We don't have much else to add as Jeff explains it much better than we could ever hope to.  We highly recommend you follow his daily/weekly market musings as they're quick, smart and loaded with great stories.

---


Saturday, September 5, 2015

Week In Review (8/31/15 - 9/4/15)

U.S stocks capped off a tough week with another session in the red yesterday.  The S&P 500 finished down about 1.5% on Friday and lost 3.4% for the week.  The Nasdaq held up slightly better by losing only 1.05% yesterday and 3% over the course of the week.


Concern over China's slowing economy was once again a big theme this week as investors have been impacted by recent negative headlines coming out of the region.  On Tuesday, it was reported that manufacturing activity in China had fallen to a 3-year low and many are concerned about how this may impact China's regional neighbors like South Korea and Austrailia.  So while the larger cap, multinational-led indexes struggled this week, small cap stocks actually fared a bit better as they're less reliant on foreign customers.  The Russell 2000 fell only 2.3% for the week and displayed some decent relative strength against its large cap counterparts.

Yesterday's losses were preceded by, and likely attributable to, an unexpectedly weak August jobs report.  Per Reuters:


"Nonfarm payrolls increased 173,000 last month, fewer than the 220,000 that economists polled by Reuters had expected. But the unemployment rate dropped to 5.1 percent, its lowest in more than seven years, and wages accelerated. Many investors viewed those data points as contradictory signals about the urgency to increase interest rates."

The number gave investors even more confusion over whether the Federal Reserve was preparing to raise interest rates at their next meeting September 16-17.  Futures traders have backed off their certainty in recent weeks as the implied probability of a rate hike has dropped from over 50% to near 30% over the last month.


The Nasdaq remains the clear leader on a year-to-date basis as it fights to stay near-flat.  The remaining U.S. stock indexes have fallen decidedly into negative territory.


Thursday, September 3, 2015

"Most market moves are random, much as the news media hates to admit it."

The title of this blog was pulled from an article penned Monday by Felix Salmon of Fusion.net. The piece has been making the rounds this week and we think it carries some degree of merit:

"In America, by contrast, the many, many problems with stock-market reporting have less to do with individual investors getting panicked and selling their stocks. That kind of behavior actually happens much less than it used to, partly because individual investors are a much smaller proportion of the market, and partly because the “don’t panic, you’re invested for the long term” message has finally gotten through to a large proportion of the investor base.


The problem, rather, is that the message has not gotten through to the overwhelming majority of Americans – people who don’t individually invest in the stock market. Most Americans have no stock market savings, either because they don’t have any savings, or because they don’t invest their savings in stocks. When these people see reporters breathlessly talking about markets going up and markets going down, they reasonably enough conclude that this news is important. The result is that a lot of Americans end up feeling stupid, because they don’t really understand what all the reports mean, and also because the reports themselves have almost zero useful or important information in them."

--

As the article and the above passage suggests, investors today are flooded with a seemingly non-stop flow of intimidating market related news.  While some intraday and day-to-day happenings can contain relevant data that will impact market direction, much of it should be written off as noise that contributes absolutely nothing to the long-term direction of stocks.

While we realize that this blog could be categorized as one of those outlets, we make every effort to be deliberate in our commentary and keep our opinions and biases out of the equation.  Certainly we'll always have them but we're smart enough to know that 1) they don't mean a thing in the larger scheme of things and 2) there's a huge risk of them being wrong.  So why try to force our thoughts upon anyone else?  Our goal is to simply share data and observations and then allow our readers to draw their own conclusions if they so choose.

We think Salmon's article brings up some valid points for consideration.  Every investor/trader has (or should have) a process in terms of how they make buy and sell decisions.  Perhaps they should incorporate into this process a set of rules for how they consume, filter and identify the endless stream market related news available to them.

Something to think about the next time you perform an evaluation of your investing process.