As we discussed in August 25th's Case of the Mondays post, we still believe
there's plenty of data to suggest the next few weeks/months will be quite
volatile. We're of the mind that the late August volatility won't just
simply wash away like last October's sharp pullback. We came across Doug Kass' latest market commentary
and found ourselves both impressed and agreeing with some stats generated
by Bianco Research:
“Bianco Research has done some excellent work on market volatility that I
wanted to share.
Drops of 10%-plus in only four trading days is a rare phenomenon. A 10% drop
occurred Aug. 21-25; that’s only the ninth time since the Great Depression. As
seen below, these events are typically an outgrowth of major economic or
corporate failures.
The other eight periods of 10%-plus drops were seen in August 2011 (U.S. lost its AAA credit rating), October 2008 (financial crisis), July 2002 (Worldcom defaulted), August 1998 (Long Term Capital failed), October 1987 (portfolio insurance causes a stock market crash), May 1962 (President Kennedy introduces steel tariffs), May 1940 (Battle of Britain) and March 1938 (Fed policy error).
The other eight periods of 10%-plus drops were seen in August 2011 (U.S. lost its AAA credit rating), October 2008 (financial crisis), July 2002 (Worldcom defaulted), August 1998 (Long Term Capital failed), October 1987 (portfolio insurance causes a stock market crash), May 1962 (President Kennedy introduces steel tariffs), May 1940 (Battle of Britain) and March 1938 (Fed policy error).
Importantly, according to Bob Farrell, ‘all these drops were followed
by retests or lower lows in the weeks or months later, whether in bear or bull
markets.’
Only two of these
drawdowns occurred in bull markets– in 1998 and 2011 (Jim "El Capitan”
Cramer discussed August 2011 on Mad Money last night). Accordingly, if you
think the recent drop is within the context of a bull market sell-off, those
two years might be instructive. Bob mentioned to me that 'in 1998, the volatile
four-day crash established the low for the reaction in late August which was
tested in early October. New highs were reached four months after the low. In
2011, the lows were made in mid-August and were tested three times with a
slightly lower final low made in early October. It took five months to rebuild
and get back to new highs.’
Bob calls these “best case” scenarios.“
---
Another important measure
for us in observing the market's "health" is staying up-to-date on
breadth readings. In a normal correction, downside breadth will usually
exhaust itself and bottom out before price. It seems as if that could be
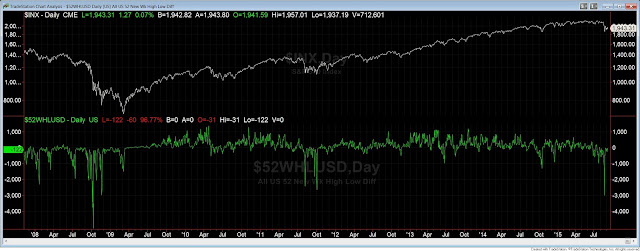
happening in this instance as late August brought about the highest reading of
new 52 week lows on the NYSE since the fall 2011 correction. Further, the
52 week high-low differential hit its lowest point since the financial crisis.
Lastly, we found these tweets from MarketTells.com yesterday to be something worth watching through tomorrow's close:
While it doesn't offer us any insight on the
likely direction of the 3% move, let's hope that with today's 0.5% gain that
tomorrow isn't a complete wipeout to the downside.
In the Kass article linked above, he suggests using the fall of 2011 (European
Debt Crisis) as a template for how the next few months might unfold.
While that's entirely understandable and he may very well be right, we're
inclined to side with comparisons against the weeks/months following the 2010
Flash Crash as we felt that August 24th was very similar to the day of the
Flash Crash (May 6th, 2010). But with the volatile moves in currencies
and continued weakness in commodities we can't rule out a bigger crisis similar
to 2011.


