- Last 20 years: May ranks 7th in monthly performance with average return of .28%
- Last 20 years: The average daily trend for May looks a bit choppy on the chart below however it's been the 2nd least volatile month.
- Last 20 years: If the prior month is positive and the S&P is up YTD, May has an average loss of -.27%
- Since 1950: May ranks 8th in monthly performance with an average gain of .23%
- Since 1950: Contradicting the last 20 year data, if the prior month is positive and the S&P is up YTD, May has an average gain of .58%
- May begins the seasonally weaker 6-month period that produces the lowest average gain of any rolling 6-month period in the calendar


The S&P continues to show signs of health as characterized by up-trending 50 and 200-day moving averages while also setting up for a potential upside breakout. The index is not overbought by our measures as momentum has stalled a bit recently.
Meanwhile, the Nasdaq has been THE winner so far in 2017 and as a result looks a bit extended and overbought at the moment.
Pullbacks continue to be bought as they've remained shallow and short since the election. However, as the excellent blog fat pitch points out, the current run in the S&P without a 5% correction could be getting a little long in the tooth...
"While the trend is higher, it is notable that it has been 120 days since SPX's last 5% (or greater) correction. Since 2009, there have been only 3 uninterrupted uptrends that have lasted longer, all taking place during 2013-14: 127 days (ending May 2013), 142 days (ending January 2014) and 158 days (ending September 2014). If past is prologue, then SPX appears likely to have a 5% correction by May 10 (127 days) to June 23 (158 days). That would fit a seasonal pattern as well (discussed below)"

One thing we would like to see is a pick up in breadth. The number of 52-week highs (middle pane) and the % of stocks above their 50-day moving average (lower pane) on the S&P both have lagged while the S&P has recently tested new highs. If the S&P breaks the 2,400 level to the upside we would like to see an expansion in each of these indicators.

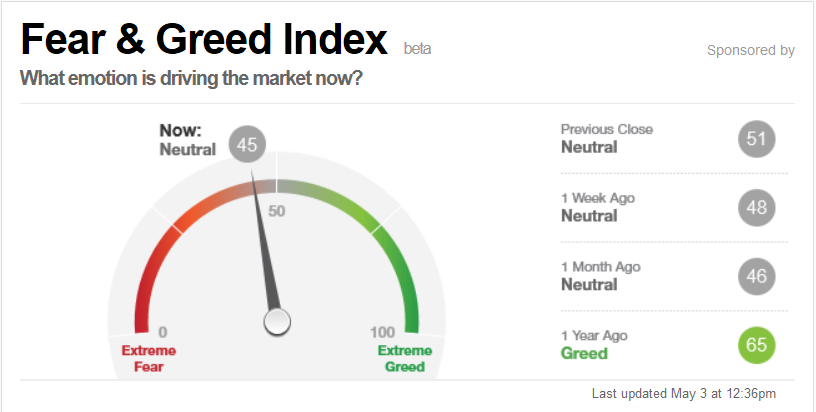
Sentiment continues to be neutral as the CNN Fear & Greed Index shows. This should ultimately be good for a continuation higher.
Conclusion
The trend remains friendly to the bulls and patience should be rewarded. Breadth and momentum have stalled as the S&P has consolidated over the last two months. If the index breaks out to a new high we'll want to see it accompanied by accumulation and broad breadth. However, if this market is to experience a short-term correction of greater than 5% the seasonally weak summer months would provide the perfect timing from a historical context.