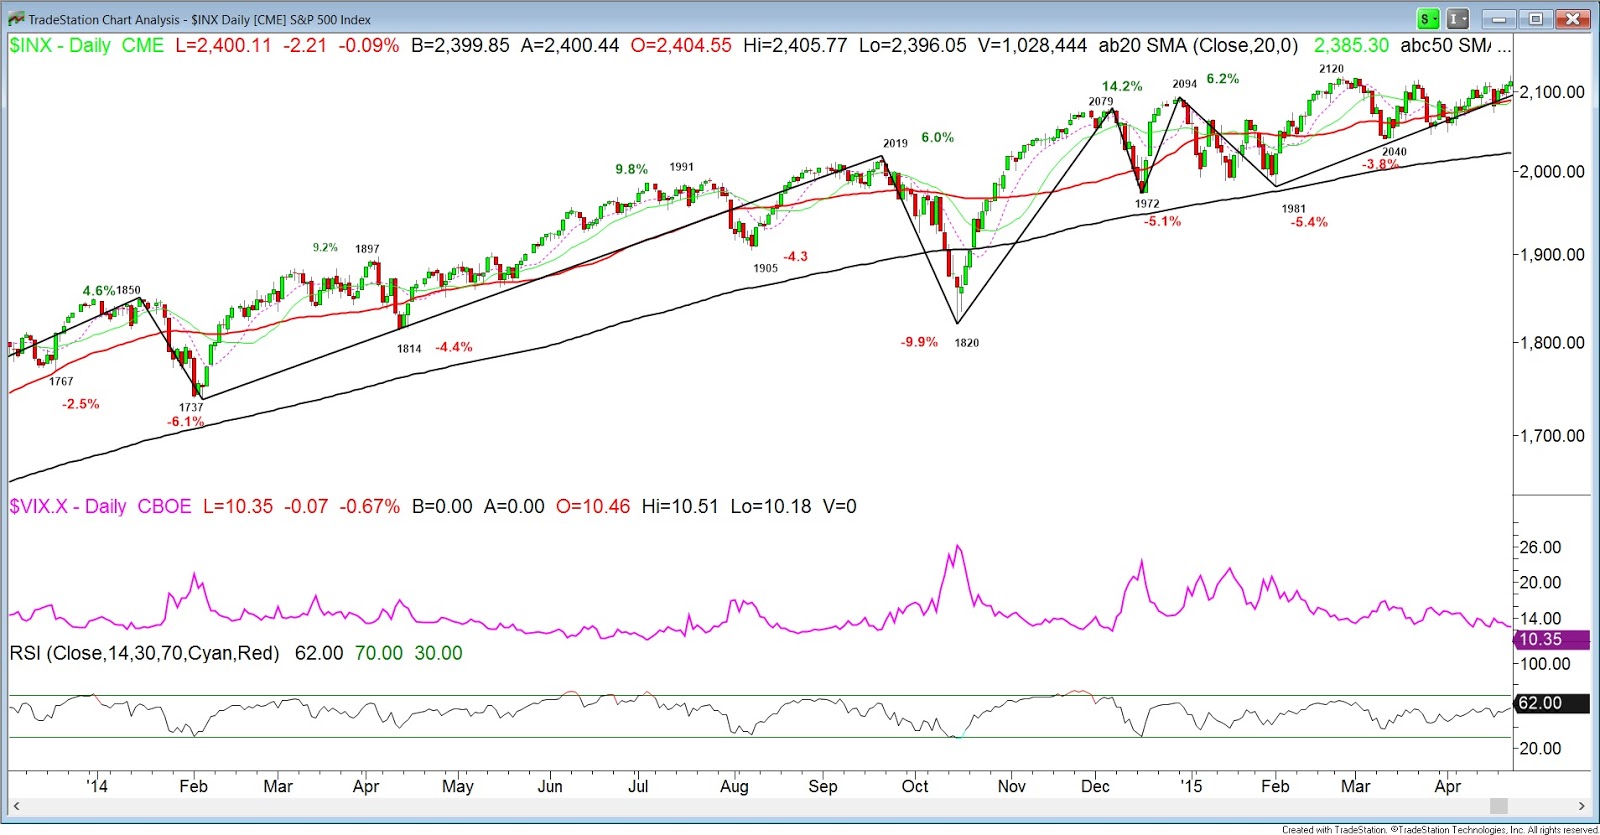
As we have discussed in multiple posts, this market looks very similar to the 2013 when the S&P trended higher all year. We've also touched on how even steadily trending markets can (and should) experience small and shallow corrections. For instance, 2013 had just one pullback greater than 5% which was a 7.5% drop that lasted throughout May and June. Other than that, there were a handful of smaller 3-5% declines along the way.
So far, it's looking as if 2017 will follow a similar path. If we look at that stats, we know that a 5% correction is due sooner rather than later. The S&P has now gone 132 trading days without a fall of at least 5%. Since the 2009 low, there have been just two other periods in which the S&P went longer in between 5% pullbacks. One of those periods was the 140-day run in the second half of 2013 after the aforementioned June bottom. It should be noted however that this streak also featured separate pullbacks of -4.8% and -4.9%. The other post-2009 stretch occurred in 2014 and lasted 155 days.
Current S&P 500

2014
2013

While the S&P 500 has enjoyed its strong uptrend, breadth and momentum have continued to lag. One breadth indicator we track looks at the % of stocks above their 10, 20, 50, and 200-day moving averages. As you can see below, all 4 indicators are declining as the S&P is making new highs. At some point this negative divergence needs to be resolved for the S&P to continue higher. If not it could be a precursor to the 5% correction everyone seems to want.

One of our favorite tools for getting a read on the sentiment and psychology of the market is the monthly fund manger survey from BAML. Below are some of this month's key takeaways:
- May FMS is Goldilocks bullish; we believe this will lead to Icarus upside
- FMS cash @ 4.9% too high for "big top" in markets, too early to short the "excess valuation" in stocks
- Contrarians note...#1 "crowded trade" now long Nasdaq and #1 "tail risk" now China deleveraging
Bullish, but not bullish enough... for us to change our Icarus Trade directional view of more upside to risk assets. May FMS sentiment bullish, but irrationality not yet visible despite all-time highs in credit & equity markets, robust global EPS, benign French election result...
FMS cash levels unchanged @ 4.9%: May FMS cash levels too high for "big top" in markets. Note comp with 1999-2000 tech "bubble" when FMS cash "irrationally" declined sharply given widespread "excess valuation" views (Exhibit 1); May FMS shows investor view of "excess valuation" in stocks highest since Jan'2000 but cash not (yet) collapsing.
Macro Goldilocks: Macro expectations of "Goldilocks" (high growth, low inflation) at record high; % predicting >10% EPS growth next 12 months highest since Jul'11; % taking out protection lowest since 2014. Long vol, short cyclicals is contrarian.
Top 3 FMS "crowded trades" are: long Nasdaq (26%), long European equities (15%), long US$ (12%). Healthy news for US$ as 5-month streak of "long US$" as most "crowded trade" ends (Exhibit 3).
Biggest FMS "tail risk" now: China credit tightening, ending EU disintegration as #1 tail risk. But just 22% expect Chinese deleveraging to either cause global volatility or global slowdown. Crash in bonds #2 tail risk but yields far from levels (3.5-4% in US) deemed dangerous for markets.
The longs & shorts of May: Eurozone equities (3rd highest ever); short US stocks vs RoW most extreme since Nov'07; May sees rotation to industrials from utilities; banks, discretionary, tech most popular sectors; UK assets and energy still shunned.
FMS contrarian trades: a contrarian macro bear (expecting falling PMI's) would go long bonds, staples and short banks, Eurozone stocks; a contrarian macro bull (expecting higher CPI) would short discretionary, tech, and buy UK assets and energy.
.....It looks like the French elections eased some of the concern for the tail risk associated with a potential EU disintegration. This has coincided with favorable market conditions.

And now the most crowded trade for the first time in a while is long Nasdaq as the FANG stocks have led the overall market higher. This also confirms the breakdown in breadth. The general market has thrived off concentrated leadership as big cap tech seems to be keeping everything afloat. The performance chart below shows how much of an impact technology stocks are having on performance this year while financials and energy remain a drag.


There's still too much cash parked on the sidelines and this continues to be a catalyst that could drive markets higher. Meanwhile, according to fund managers, equities look the most overvalued since January of 2000. This seems to have driven them away from US stocks and into cheaper regions. Allocations to US equities remain below the long-term average while allocations to Eurozone equities surged to the highest level since March 2015 and the third highest on record.


